OPEN-SOURCE SCRIPT
Point of Control (POC)
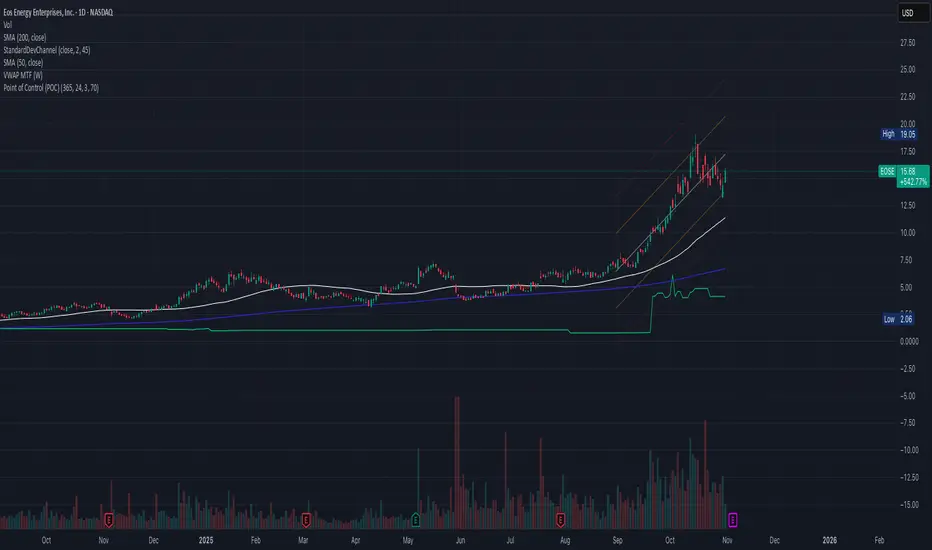
**Point of Control (POC) Indicator**
This indicator identifies the price level where the most trading volume occurred over a specified lookback period (default: 365 days). The POC represents a significant support/resistance level where the market found the most acceptance.
**Key Features:**
- **POC Line**: Bright green horizontal line showing the highest volume price level
- **Volume Profile Analysis**: Divides price range into rows and calculates volume distribution
- **Value Area (Optional)**: Shows VAH and VAL levels containing 70% of total volume
- **Customizable**: Adjust lookback period, price resolution, colors, and line width
**How to Use:**
- POC acts as a magnet - price often returns to test these high-volume levels
- Strong support/resistance zone where significant trading activity occurred
- Useful for identifying key price levels for entries, exits, and stops
- Higher lookback periods (365 days) show longer-term significant levels
**Settings:**
- Lookback Period: Number of bars to analyze (default: 365)
- Price Rows: Calculation resolution - higher = more precise (default: 24)
- Toggle Value Area High/Low for additional context
---
오픈 소스 스크립트
트레이딩뷰의 진정한 정신에 따라, 이 스크립트의 작성자는 이를 오픈소스로 공개하여 트레이더들이 기능을 검토하고 검증할 수 있도록 했습니다. 작성자에게 찬사를 보냅니다! 이 코드는 무료로 사용할 수 있지만, 코드를 재게시하는 경우 하우스 룰이 적용된다는 점을 기억하세요.
면책사항
해당 정보와 게시물은 금융, 투자, 트레이딩 또는 기타 유형의 조언이나 권장 사항으로 간주되지 않으며, 트레이딩뷰에서 제공하거나 보증하는 것이 아닙니다. 자세한 내용은 이용 약관을 참조하세요.
오픈 소스 스크립트
트레이딩뷰의 진정한 정신에 따라, 이 스크립트의 작성자는 이를 오픈소스로 공개하여 트레이더들이 기능을 검토하고 검증할 수 있도록 했습니다. 작성자에게 찬사를 보냅니다! 이 코드는 무료로 사용할 수 있지만, 코드를 재게시하는 경우 하우스 룰이 적용된다는 점을 기억하세요.
면책사항
해당 정보와 게시물은 금융, 투자, 트레이딩 또는 기타 유형의 조언이나 권장 사항으로 간주되지 않으며, 트레이딩뷰에서 제공하거나 보증하는 것이 아닙니다. 자세한 내용은 이용 약관을 참조하세요.