OPEN-SOURCE SCRIPT
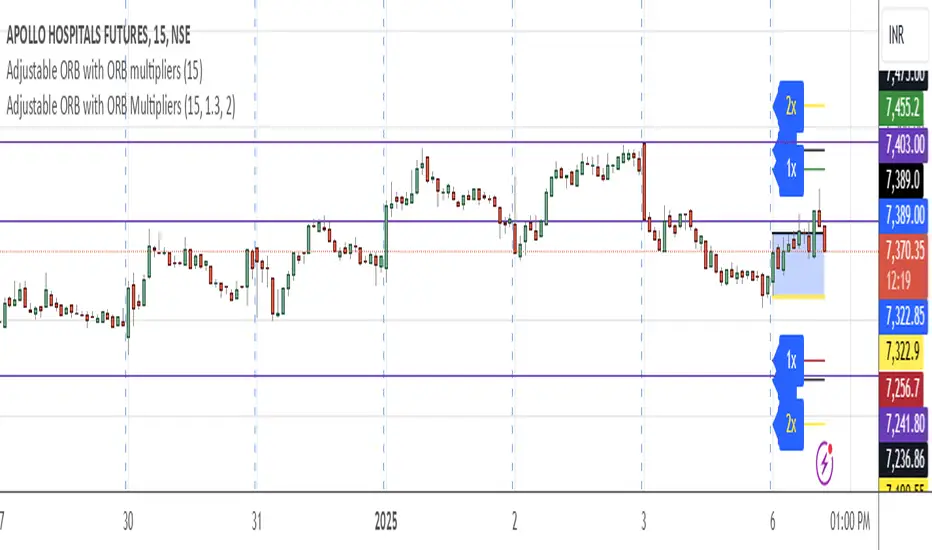
Adjustable ORB with ORB Multipliers 1x or 2x by dhaval chhayani

Key Features:
Adjustable Timeframe:
The ORB is calculated using a user-defined timeframe, which defaults to 15 minutes.
Dynamic High/Low Levels:
Identifies the high and low of the first bar of the specified timeframe for each trading day.
Resets these levels at the start of each new day.
Multipliers for Breakout Levels:
Calculates breakout levels using 1.3x and 2x the ORB range, both above and below the opening range.
Displays these levels on the chart with user-controlled visibility.
Labels for Breakout Levels:
Adds labels (1x, 2x) at the breakout levels for better visualization.
Dynamically updates or removes labels based on current conditions.
Visual Representation:
The opening range (high and low) is plotted with blue lines and filled with a shaded area for clarity.
Breakout levels are plotted in white and yellow, representing the respective multipliers.
Day-Specific Logic:
Ensures the indicator only operates for the current day and clears data for previous or upcoming days.
오픈 소스 스크립트
트레이딩뷰의 진정한 정신에 따라, 이 스크립트의 작성자는 이를 오픈소스로 공개하여 트레이더들이 기능을 검토하고 검증할 수 있도록 했습니다. 작성자에게 찬사를 보냅니다! 이 코드는 무료로 사용할 수 있지만, 코드를 재게시하는 경우 하우스 룰이 적용된다는 점을 기억하세요.
면책사항
해당 정보와 게시물은 금융, 투자, 트레이딩 또는 기타 유형의 조언이나 권장 사항으로 간주되지 않으며, 트레이딩뷰에서 제공하거나 보증하는 것이 아닙니다. 자세한 내용은 이용 약관을 참조하세요.
오픈 소스 스크립트
트레이딩뷰의 진정한 정신에 따라, 이 스크립트의 작성자는 이를 오픈소스로 공개하여 트레이더들이 기능을 검토하고 검증할 수 있도록 했습니다. 작성자에게 찬사를 보냅니다! 이 코드는 무료로 사용할 수 있지만, 코드를 재게시하는 경우 하우스 룰이 적용된다는 점을 기억하세요.
면책사항
해당 정보와 게시물은 금융, 투자, 트레이딩 또는 기타 유형의 조언이나 권장 사항으로 간주되지 않으며, 트레이딩뷰에서 제공하거나 보증하는 것이 아닙니다. 자세한 내용은 이용 약관을 참조하세요.