PROTECTED SOURCE SCRIPT
업데이트됨 Index Trend Map
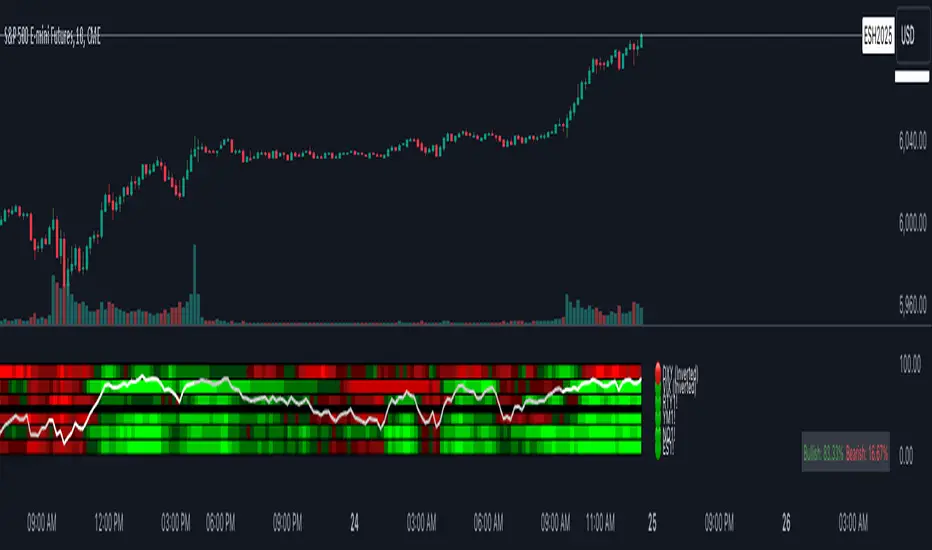
The Index Trend Map is a versatile and powerful tool designed to provide a sentiment heatmap for major market indices. This indicator tracks the average trend direction across multiple indices data points, including a default setting for S&P 500 Futures ( ES), Nasdaq 100 Futures (NNQ), Dow Jones Futures (YYM), Russell 2000 Futures (
 RTY) and traditionally inverse data points like the VIX– allowing traders to quickly assess overall market sentiment and make more informed trading decisions.
Key Features:
Heatmap Visualization:
Dynamic Table:
Located in the bottom right corner, this table displays real-time percentages of indices that are bullish and bearish. Example: If 4 out of 6 index data points are bullish, the table will show 66.6% bullish and 33.3% bearish.
Best Used For:
Key Features:
- Sentiment Heatmap: Displays a color-coded heatmap for indices, with green indicating bullish sentiment and red indicating bearish sentiment. Each index’s sentiment is calculated on a scale from 0 to 100, with 50 as the neutral point.
- Bullish/Bearish Percentages: Real-time calculations of the percentage of indices in bullish or bearish territory are displayed in a dynamic table for easy reference.
- Tracks Major Indices: Monitors popular indices or their related futures contracts with the option to include custom tickers.
- Inverse Sentiment Options: Allows users to invert sentiment calculations for specific symbols (e.g., VIX or DXY) to reflect their inverse relationship to broader market trends.
- Customizable Moving Averages: Choose from SMA, EMA, WMA, or DEMA to tailor the trend calculation to your trading strategy.
- Overlay Sentiment Colors on Candles: Option to display sentiment as green (bullish) or red (bearish) directly on price chart candles, enhancing market trend visibility.
Heatmap Visualization:
- The heatmap assigns each index a sentiment score based on its calculated average.
- Sentiment values above the 50 midline indicate bullish sentiment, while those below 50 indicate bearish sentiment.
Dynamic Table:
Located in the bottom right corner, this table displays real-time percentages of indices that are bullish and bearish. Example: If 4 out of 6 index data points are bullish, the table will show 66.6% bullish and 33.3% bearish.
Best Used For:
- Intraday Traders: Assess real-time index sentiment during active market hours to make data-driven trading decisions.
- Swing Traders: Monitor index trends over time to identify shifts in market sentiment and positioning opportunities.
- Market Breadth Analysis: Identify broader market strength or weakness by analyzing multiple indices simultaneously.
릴리즈 노트
Updated Chart Issue.릴리즈 노트
Fixed small display bug.보호된 스크립트입니다
이 스크립트는 비공개 소스로 게시됩니다. 하지만 이를 자유롭게 제한 없이 사용할 수 있습니다 – 자세한 내용은 여기에서 확인하세요.
면책사항
해당 정보와 게시물은 금융, 투자, 트레이딩 또는 기타 유형의 조언이나 권장 사항으로 간주되지 않으며, 트레이딩뷰에서 제공하거나 보증하는 것이 아닙니다. 자세한 내용은 이용 약관을 참조하세요.
보호된 스크립트입니다
이 스크립트는 비공개 소스로 게시됩니다. 하지만 이를 자유롭게 제한 없이 사용할 수 있습니다 – 자세한 내용은 여기에서 확인하세요.
면책사항
해당 정보와 게시물은 금융, 투자, 트레이딩 또는 기타 유형의 조언이나 권장 사항으로 간주되지 않으며, 트레이딩뷰에서 제공하거나 보증하는 것이 아닙니다. 자세한 내용은 이용 약관을 참조하세요.