INVITE-ONLY SCRIPT
Operator Entry Detector and their Support and resistance Zones
Introduction:
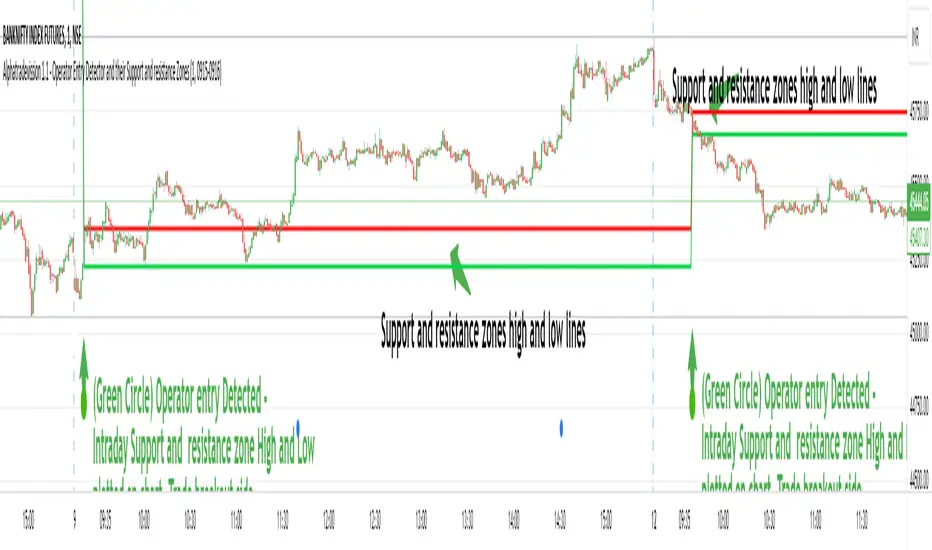
The indicator is designed to detect specific market conditions related to operator entries and identify support and resistance zones.
Developed by Sarangdhar, this version is labeled as Alphatradevission 1.1
Key Features:-
Utilizes Heavy Volume Change to identify operator entry signals.
Displays support and resistance zones based on the Specific Calculated Volume Length values.
Highlights potential trend reversal or continuation zones using specific chart patterns and Specific Calculated Volume Change Length values
Settings:
Option to hide/show lines and labels for a cleaner chart presentation.
Defines regular trading hours and considers the 9:15 AM candle for analysis.
Visual Elements:
Uses various shapes and colors to represent different market scenarios:
Circles for the 9:15 AM candle to Understand New Trading Session Started.
Triangles for Volume change signals.
Different colors for distinct VC levels.
Green diamonds with numbering for identified trend starter signals.
Signals and Zones:
Detects specific VC values to signal potential trend starters, small sharks, and big sharks.
Labels support and resistance zones based on the 9:15 AM candle and VC signals.
Highlights reversal and trend continuation zones based on Specific VC length given in script.
Customization:
Traders can adjust input parameters to suit their preferred timeframes and market conditions.
The option to hide/show lines and labels allows users to customize the indicator display.
How users can make profit using this script ?
Usage Tips: Chart 1 min time frame
Users may consider potential trend changes or continuations based on identified VC signals.
Support and resistance zones can be utilized for setting stop-loss or take-profit levels.
1. That zone will act as support and resistance through out day.
5. Trade Breakout direction of that range. As range break market trend start in that direction.
6. If Candle range High break - traders view must be buying the stock with stoploss just below the candle range and vice versa.
Note :-
1. Avoid Fake breakout of candle range . take entry after breakout confirmation. You can take entry after retest to that candle range.
Giving below example of reversal and trend continuation zones high low line by hiding intraday Support and resistance zone lines you can costomize it as per use,
https://www.tradingview.com/x/zabQNvLZ/
초대 전용 스크립트
이 스크립트는 작성자가 승인한 사용자만 접근할 수 있습니다. 사용하려면 요청 후 승인을 받아야 하며, 일반적으로 결제 후에 허가가 부여됩니다. 자세한 내용은 아래 작성자의 안내를 따르거나 I_am_Operator_Detector에게 직접 문의하세요.
트레이딩뷰는 스크립트의 작동 방식을 충분히 이해하고 작성자를 완전히 신뢰하지 않는 이상, 해당 스크립트에 비용을 지불하거나 사용하는 것을 권장하지 않습니다. 커뮤니티 스크립트에서 무료 오픈소스 대안을 찾아보실 수도 있습니다.
작성자 지시 사항
contact us. mail on alphatradevission@gmail.com / Text me on my profile
면책사항
해당 정보와 게시물은 금융, 투자, 트레이딩 또는 기타 유형의 조언이나 권장 사항으로 간주되지 않으며, 트레이딩뷰에서 제공하거나 보증하는 것이 아닙니다. 자세한 내용은 이용 약관을 참조하세요.