OPEN-SOURCE SCRIPT
업데이트됨 TPI

You know who you are.
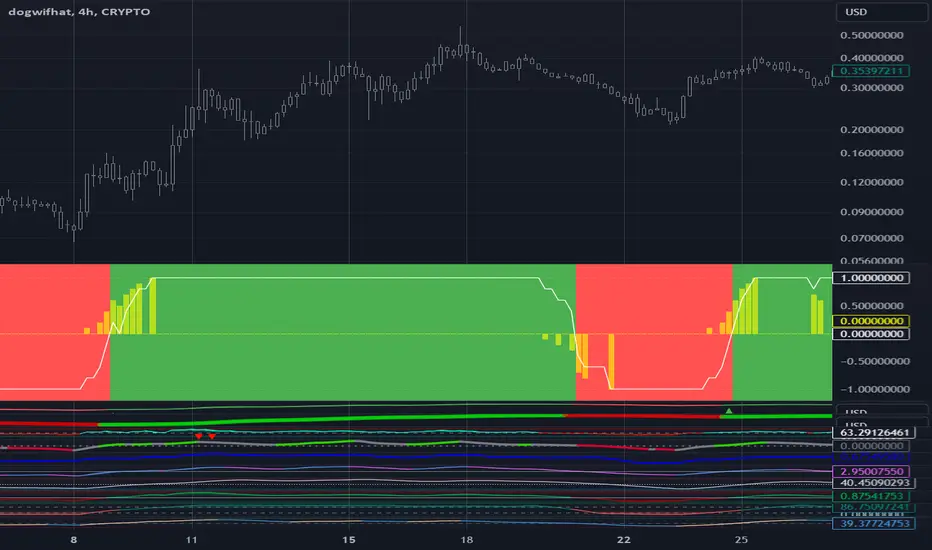
Use the "Plot" option one indicator at a time to verify that you have the correct time series for each indicator and that the bullish/bearish formula you enter is correct. Only one indicator can be plotted at a time and the best source of validation is the numerical value from the last candle that shows as a highlight in each indicator.
After you have verified that all indicators are correctly set up click on "Use in TPI" and make sure no "Plot" option is selected.
Set the Threshold to "1000" to define the +1/-1 TPI component value by comparing two time series data (usually on perpetual indicators) as opposed to the fixed value in Threshold (usually on oscillators).
Zero range specifies a band around which the difference between the two values will be considered zero. -1 disables it and outputs only +1/-1 values for each component.
Good luck!
릴리즈 노트
You know who you are.Use the "Plot" option one indicator at a time to verify that you have the correct time series for each indicator and that the bullish/bearish formula you enter is correct. Only one indicator can be plotted at a time and the best source of validation is the numerical value from the last candle that shows as a highlight in each indicator.
After you have verified that all indicators are correctly set up click on "Use in TPI" and make sure no "Plot" option is selected.
Set the Threshold to "1000" to define the +1/-1 TPI component value by comparing two time series data (usually on perpetual indicators) as opposed to the fixed value in Threshold (usually on oscillators).
Zero range specifies a band around which the difference between the two values will be considered zero. -1 disables it and outputs only +1/-1 values for each component.
Good luck!
릴리즈 노트
Adding -1/+1 lines so that the scale remains the same irrespective of the period.릴리즈 노트
Added rate of change and split TPI from signal to better support alert generation릴리즈 노트
Added number of bars the TPI has remained at +1 to be used as a strategy input.릴리즈 노트
Added the option to have the day of the month on TPI transitions to help in indicator tunning.릴리즈 노트
Add the ability to exports TPI transition dates to aid with indicator selection and optimization.릴리즈 노트
Fixed error on exported day of the transition date오픈 소스 스크립트
트레이딩뷰의 진정한 정신에 따라, 이 스크립트의 작성자는 이를 오픈소스로 공개하여 트레이더들이 기능을 검토하고 검증할 수 있도록 했습니다. 작성자에게 찬사를 보냅니다! 이 코드는 무료로 사용할 수 있지만, 코드를 재게시하는 경우 하우스 룰이 적용된다는 점을 기억하세요.
면책사항
해당 정보와 게시물은 금융, 투자, 트레이딩 또는 기타 유형의 조언이나 권장 사항으로 간주되지 않으며, 트레이딩뷰에서 제공하거나 보증하는 것이 아닙니다. 자세한 내용은 이용 약관을 참조하세요.
오픈 소스 스크립트
트레이딩뷰의 진정한 정신에 따라, 이 스크립트의 작성자는 이를 오픈소스로 공개하여 트레이더들이 기능을 검토하고 검증할 수 있도록 했습니다. 작성자에게 찬사를 보냅니다! 이 코드는 무료로 사용할 수 있지만, 코드를 재게시하는 경우 하우스 룰이 적용된다는 점을 기억하세요.
면책사항
해당 정보와 게시물은 금융, 투자, 트레이딩 또는 기타 유형의 조언이나 권장 사항으로 간주되지 않으며, 트레이딩뷰에서 제공하거나 보증하는 것이 아닙니다. 자세한 내용은 이용 약관을 참조하세요.