PROTECTED SOURCE SCRIPT
AJCrows Bollinger Bands Tunnel
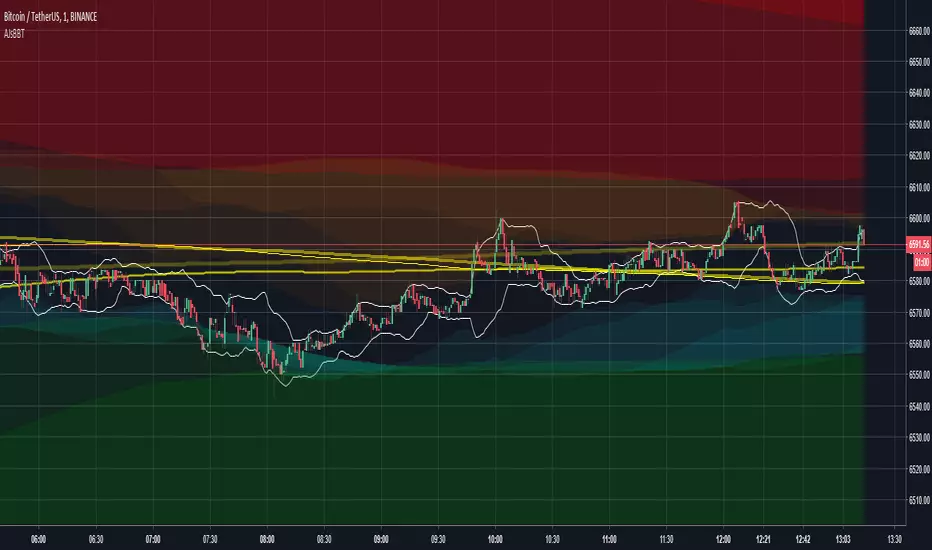
This script is created for Bitcoin (might work with other cryptocurrencies and other assets as well). And for 1m chart ONLY! It's meant to give day traders a wider picture what is going on with the price.
It uses bollinger bands from various timeframes to illustrate volatility. It creates this "tunnel" where the price moves. Walls of the tunnel performs as support/resistance. When the wall gets thicker, the more it resists the price movement. When the tunnel narrows and the walls around the price gets even thicker, price wants to make a stronger move and push the walls wider. Since the walls are basically bollinger bands, you can use other bb signals to make trades with this indicator.
You can hide unwanted plots form the settings and fiddle with the colors.
Red areas = upper bands of 30m, 1h, 2h and 4h bollinger bands
Green areas = lower bands of 30m, 1h, 2h and 4h bollinger bands
Yellow lines = SMA(20) of 30m, 1h, 2h and 4h price movement
Orange areas = upper bands of 3m, 5m,10m and 15m bollinger bands
Aqua areas = lower bands of 3m, 5m,10m and 15m bollinger bands
White lines = 1m bollinger bands
NOTE! The various bb timeframes are calculated from 1m data, they are not 100% precise. For example: 5m bands are calculated using a range of 100 for the standard moving average and the standard deviation.
보호된 스크립트입니다
이 스크립트는 비공개 소스로 게시됩니다. 하지만 이를 자유롭게 제한 없이 사용할 수 있습니다 – 자세한 내용은 여기에서 확인하세요.
면책사항
해당 정보와 게시물은 금융, 투자, 트레이딩 또는 기타 유형의 조언이나 권장 사항으로 간주되지 않으며, 트레이딩뷰에서 제공하거나 보증하는 것이 아닙니다. 자세한 내용은 이용 약관을 참조하세요.
면책사항
해당 정보와 게시물은 금융, 투자, 트레이딩 또는 기타 유형의 조언이나 권장 사항으로 간주되지 않으며, 트레이딩뷰에서 제공하거나 보증하는 것이 아닙니다. 자세한 내용은 이용 약관을 참조하세요.