OPEN-SOURCE SCRIPT
Sharpe Ratio
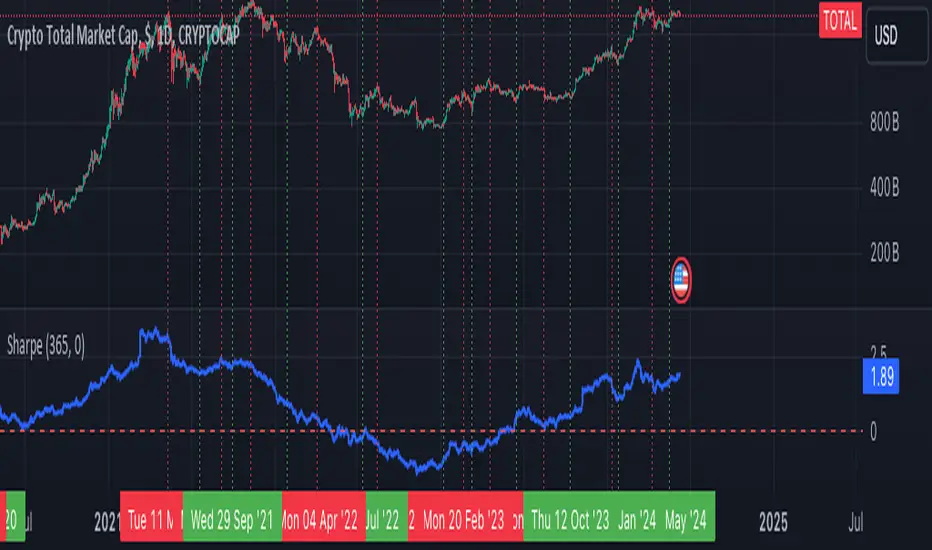
The Sharpe Ratio Indicator is a widely-used tool designed to measure the risk-adjusted performance of an asset. The Sharpe Ratio helps investors understand how much excess return they are receiving for the extra volatility endured for holding a riskier asset. By comparing the return of an investment to the risk-free rate and accounting for the volatility of the investment's returns, the Sharpe Ratio provides a clear metric for evaluating the return on investment per unit of risk.
Features:
Calculation Period Input: Allows users to specify the period over which the Sharpe Ratio is calculated, making it flexible and adaptable to various trading strategies and time frames.
Risk-Free Rate Input: Users can set a specific risk-free rate, enabling a customized risk-return analysis based on prevailing market conditions or individual investment preferences.
Daily Returns Calculation: The indicator calculates daily returns, which are used to determine the mean return and standard deviation.
Sharpe Ratio Calculation: The indicator calculates the Sharpe Ratio by dividing the excess return (mean return minus risk-free rate) by the standard deviation of returns and annualizing the result (assuming 252 trading days in a year).
Visual Plot: The Sharpe Ratio is plotted on the chart, with a reference zero line to help users quickly assess whether the asset's returns are favorable relative to the risk-free rate.
How to Use:
Add the Indicator to Your Chart: Copy the script into the Pine Script editor on TradingView and add it to your chart.
Specify the Calculation Period: Adjust the Calculation Period input to match your desired time frame for the Sharpe Ratio calculation.
Set the Risk-Free Rate: Input the current risk-free rate (e.g., the yield on 10-year government bonds) to customize the risk-return analysis.
Interpret the Sharpe Ratio: A higher Sharpe Ratio indicates better risk-adjusted performance, while a ratio below zero suggests that the asset has underperformed relative to the risk-free rate.
오픈 소스 스크립트
트레이딩뷰의 진정한 정신에 따라, 이 스크립트의 작성자는 이를 오픈소스로 공개하여 트레이더들이 기능을 검토하고 검증할 수 있도록 했습니다. 작성자에게 찬사를 보냅니다! 이 코드는 무료로 사용할 수 있지만, 코드를 재게시하는 경우 하우스 룰이 적용된다는 점을 기억하세요.
면책사항
해당 정보와 게시물은 금융, 투자, 트레이딩 또는 기타 유형의 조언이나 권장 사항으로 간주되지 않으며, 트레이딩뷰에서 제공하거나 보증하는 것이 아닙니다. 자세한 내용은 이용 약관을 참조하세요.
오픈 소스 스크립트
트레이딩뷰의 진정한 정신에 따라, 이 스크립트의 작성자는 이를 오픈소스로 공개하여 트레이더들이 기능을 검토하고 검증할 수 있도록 했습니다. 작성자에게 찬사를 보냅니다! 이 코드는 무료로 사용할 수 있지만, 코드를 재게시하는 경우 하우스 룰이 적용된다는 점을 기억하세요.
면책사항
해당 정보와 게시물은 금융, 투자, 트레이딩 또는 기타 유형의 조언이나 권장 사항으로 간주되지 않으며, 트레이딩뷰에서 제공하거나 보증하는 것이 아닙니다. 자세한 내용은 이용 약관을 참조하세요.