OPEN-SOURCE SCRIPT
VCP-Minervini v2
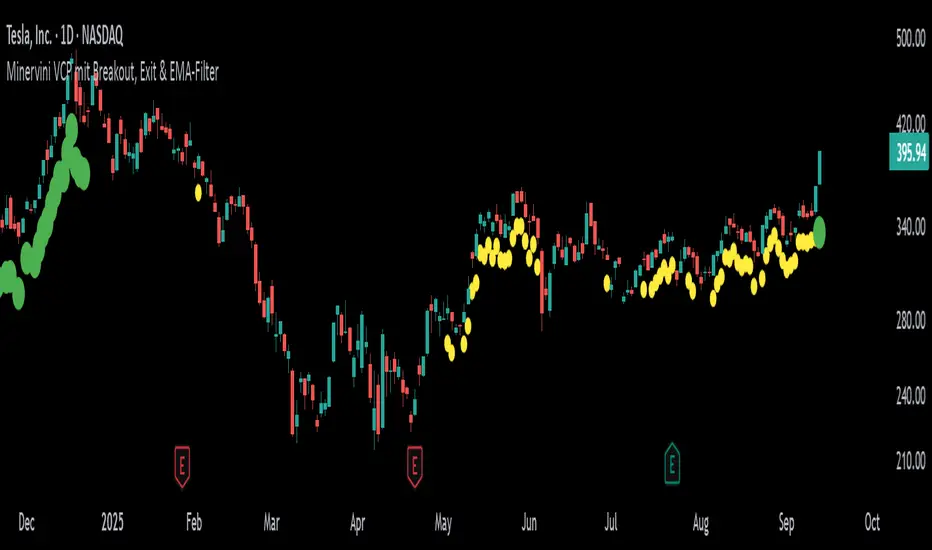
This indicator is based on the famous Volatility Contraction Pattern (VCP) developed by Mark Minervini. It is designed to detect breakout setups in stocks and indices and provides a complete framework for identifying and managing them.
VCP Detection: Uses ATR to measure contracting volatility and highlights potential setups with yellow markers.
Pivot Level: Once a VCP is detected, the script automatically fixes a pivot resistance level and plots it as a red line.
Breakout Signal: When price closes above the pivot and remains above the EMA, a green marker confirms that a breakout is active.
Exit Logic: If momentum fades (volume drops below average and True Range contracts), the green marker disappears, signaling it may be time to secure profits or adjust stops.
EMA Filter: Ensures that setups are only valid in the direction of the prevailing trend by requiring price to trade above the selected EMA.
How to use it
This tool is best suited for swing traders and position traders looking for clean breakout opportunities. It is not a simple mashup of indicators but an original combination specifically built for VCP setups.
Use primarily on daily or weekly charts of liquid stocks.
Build a watchlist from yellow markers (potential setups).
Watch for price closing above the pivot line to confirm the breakout.
Manage trades while the green marker is active, and take caution when it disappears.
Adjust the parameters to fine-tune detection sensitivity for your market or trading style.
오픈 소스 스크립트
트레이딩뷰의 진정한 정신에 따라, 이 스크립트의 작성자는 이를 오픈소스로 공개하여 트레이더들이 기능을 검토하고 검증할 수 있도록 했습니다. 작성자에게 찬사를 보냅니다! 이 코드는 무료로 사용할 수 있지만, 코드를 재게시하는 경우 하우스 룰이 적용된다는 점을 기억하세요.
면책사항
해당 정보와 게시물은 금융, 투자, 트레이딩 또는 기타 유형의 조언이나 권장 사항으로 간주되지 않으며, 트레이딩뷰에서 제공하거나 보증하는 것이 아닙니다. 자세한 내용은 이용 약관을 참조하세요.
오픈 소스 스크립트
트레이딩뷰의 진정한 정신에 따라, 이 스크립트의 작성자는 이를 오픈소스로 공개하여 트레이더들이 기능을 검토하고 검증할 수 있도록 했습니다. 작성자에게 찬사를 보냅니다! 이 코드는 무료로 사용할 수 있지만, 코드를 재게시하는 경우 하우스 룰이 적용된다는 점을 기억하세요.
면책사항
해당 정보와 게시물은 금융, 투자, 트레이딩 또는 기타 유형의 조언이나 권장 사항으로 간주되지 않으며, 트레이딩뷰에서 제공하거나 보증하는 것이 아닙니다. 자세한 내용은 이용 약관을 참조하세요.