OPEN-SOURCE SCRIPT
업데이트됨 [blackcat] L3 MACD and RSI Fusion
The MACD and RSI fusion is a popular technical analysis strategy used by traders to identify buy and sell signals in the market. The strategy makes use of two popular technical indicators, the Moving Average Convergence Divergence (MACD) and the Relative Strength Index (RSI), and combines them to create a powerful trading signal.
The MACD and RSI fusion was originally developed for the Chinese stock market and is commonly used by traders all over the world. The strategy is based on the idea that the MACD and RSI indicators can be used together to provide a more accurate and reliable signal.
To use the MACD and RSI fusion , traders need to follow a few simple steps. The following code is the TradingView Pine script v4 indicator equivalent of the original MACD and RSI fusion code:
```
//version=4
study(" MACD and RSI fusion ", overlay=false)
// Define the simple fusion indicator
simple_fusion = (ema(close, 12) - ema(close, 26)) * 1.2 + rsi(close, 14) / 50
// Define the simple fusion lag indicator
simple_fusion_lag = nz(simple_fusion[1])
// Plot the simple fusion and simple fusion lag indicators
plot(simple_fusion, color=color.blue, title="simple fusion")
plot(simple_fusion_lag, color=color.red, title="simple fusion Lag")
```
This code defines the simple fusion and simple fusion Lag indicators and plots them on the chart. The simple fusion indicator is the sum of the 12- and 26-period exponential moving averages of the closing price, multiplied by 1.2, and added to the 14-period relative strength index of the closing price, divided by 50. The simple fusion Lag indicator is the value of the simple fusion indicator from the previous period.
Traders can use the simple fusion and simple fusion Lag indicators to identify buy and sell signals. When the simple fusion indicator crosses above the simple fusion Lag indicator, it is a buy signal, and when the simple fusion indicator crosses below the simple fusion Lag indicator, it is a sell signal.
In conclusion, the MACD and RSI fusion is a simple but powerful technical analysis strategy that combines two popular technical indicators to identify buy and sell signals in the market.
릴리즈 노트
upgrade to v5릴리즈 노트
OVERVIEWThe [blackcat] L3 MACD and RSI Fusion indicator combines Moving Average Convergence Divergence (MACD) and Relative Strength Index (RSI) to create a powerful momentum oscillator. This script calculates a unique fusion signal that integrates both indicators, providing traders with enhanced insights into market trends and potential reversal points 📈💹.
FEATURES
Combines MACD and RSI for a comprehensive momentum analysis:
Input Source: Selectable source for calculations.
MACD Fast Length, Slow Length: Adjustable parameters for MACD calculation.
RSI Length: Customizable period for RSI calculation.
Histogram Scaler: Controls the sensitivity of the histogram.
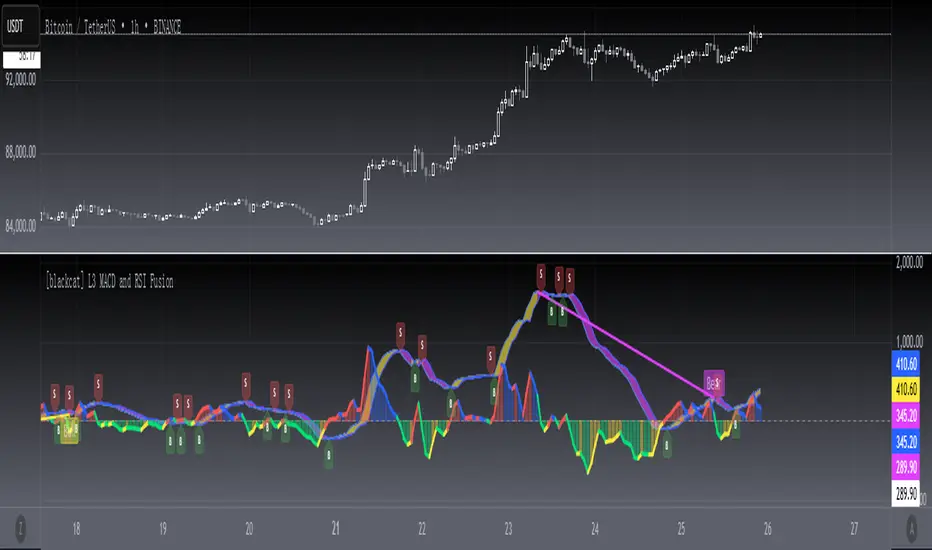
Plots the following elements on the chart:
Simple Fusion Line: Yellow line representing the combined MACD-RSI values.
Simple Fusion Lag Line: Fuchsia line acting as a reference for crossover signals.
Fusion Histogram: Visual representation of the difference between Simple Fusion and its lagged version.
Positive values in green/lime.
Negative values in red/yellow.
Identifies and plots divergence patterns:
Bullish and Hidden Bullish divergences.
Bearish and Hidden Bearish divergences.
Generates buy ('B') and sell ('S') labels based on crossover events 🏷️
Provides alerts for potential trading opportunities 🔔
HOW TO USE
Add the indicator to your TradingView chart by selecting it from the indicators list.
Adjust the input parameters (Fast Length, Slow Length, RSI Length, etc.) to suit your preferred settings ⚙️.
Monitor the chart for plotted lines and histograms indicating market momentum.
Observe the labeled divergences for potential trend reversals.
Set up alerts based on the generated signals to receive notifications when conditions are met 📲.
Use the labels and alerts to make informed trading decisions.
LIMITATIONS
The indicator may generate false signals in highly volatile or ranging markets 🌪️.
Users should combine this indicator with other forms of analysis for more reliable trading decisions.
The effectiveness of the indicator may vary depending on the asset and timeframe being analyzed.
NOTES
Ensure that you have sufficient historical data available for accurate calculations.
Test the indicator thoroughly on demo accounts before applying it to live trading 🔍.
Customize the appearance and parameters as needed to fit your trading strategy.
오픈 소스 스크립트
트레이딩뷰의 진정한 정신에 따라, 이 스크립트의 작성자는 이를 오픈소스로 공개하여 트레이더들이 기능을 검토하고 검증할 수 있도록 했습니다. 작성자에게 찬사를 보냅니다! 이 코드는 무료로 사용할 수 있지만, 코드를 재게시하는 경우 하우스 룰이 적용된다는 점을 기억하세요.
Avoid losing contact!Don't miss out! The first and most important thing to do is to join my Discord chat now! Click here to start your adventure: discord.com/invite/ZTGpQJq 防止失联,请立即行动,加入本猫聊天群: discord.com/invite/ZTGpQJq
면책사항
해당 정보와 게시물은 금융, 투자, 트레이딩 또는 기타 유형의 조언이나 권장 사항으로 간주되지 않으며, 트레이딩뷰에서 제공하거나 보증하는 것이 아닙니다. 자세한 내용은 이용 약관을 참조하세요.