PROTECTED SOURCE SCRIPT
업데이트됨 DSKOLI Base
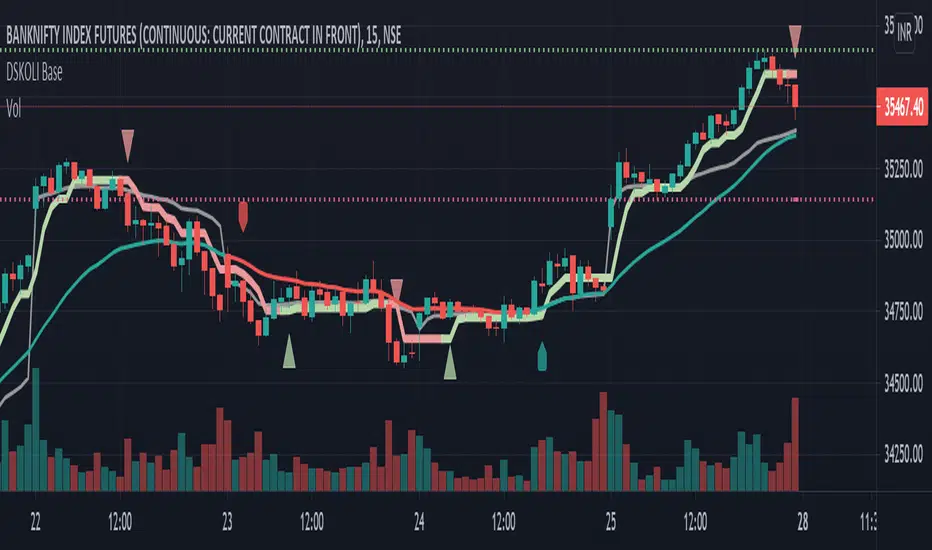
This helps to determine bullish or bearish trend of any chart on any time-frame and good to have for Intraday watch.
Details -
a. Label-Up/Down shows the recent price movement is getting bullish or bearish from zero/neutral base by comparing to previous few candles.
b. EMA line helps to know the price movement of candles are above or below the EMA and its coloured with red and green which even further helps to determine its existing trend.
c. A plot Trend line which is quite close to candles with red and green line and arrow is calculated from few candles' high and low values with some mathematical formulas which along EMA adds more value for trend identification.
d. Recent High/Low automatically plots support and resistance lines on basis of previous swing high or low. An alert is added for any these levels breakout or breakdown.
Note or Disclaimer:
1. This may be considered only for Watching as Learning and informational purpose.
2. Take advice from financial advisor before entering, holding, converting or exiting from any order or trade.
3. Always keep your acceptable stop-loss in all your transactions while trading or investing.
DSKOLI or TradingView reserves all right and don't hold any responsibilities for any loss/losses as well as accuracy of levels or price movement.
릴리즈 노트
Buffer percentage points update릴리즈 노트
Update릴리즈 노트
Update.릴리즈 노트
Update.릴리즈 노트
Update.Vertical Lines based on calculation of first 5 minute's high or open price with interval counting from 09:00 or 09:15.
Horizontal Lines based on calculation of yesterday's close, yesterday's high/low or today's open.
릴리즈 노트
Update.Removed Vertical Lines based on calculation of first 5 min's high or open price.
릴리즈 노트
Update.Vertical Lines based on calculation of first 5 minute's high or open price with interval counting from 09:00 or 09:15.
보호된 스크립트입니다
이 스크립트는 비공개 소스로 게시됩니다. 하지만 이를 자유롭게 제한 없이 사용할 수 있습니다 – 자세한 내용은 여기에서 확인하세요.
면책사항
해당 정보와 게시물은 금융, 투자, 트레이딩 또는 기타 유형의 조언이나 권장 사항으로 간주되지 않으며, 트레이딩뷰에서 제공하거나 보증하는 것이 아닙니다. 자세한 내용은 이용 약관을 참조하세요.
면책사항
해당 정보와 게시물은 금융, 투자, 트레이딩 또는 기타 유형의 조언이나 권장 사항으로 간주되지 않으며, 트레이딩뷰에서 제공하거나 보증하는 것이 아닙니다. 자세한 내용은 이용 약관을 참조하세요.