INVITE-ONLY SCRIPT
업데이트됨 Renko MACD
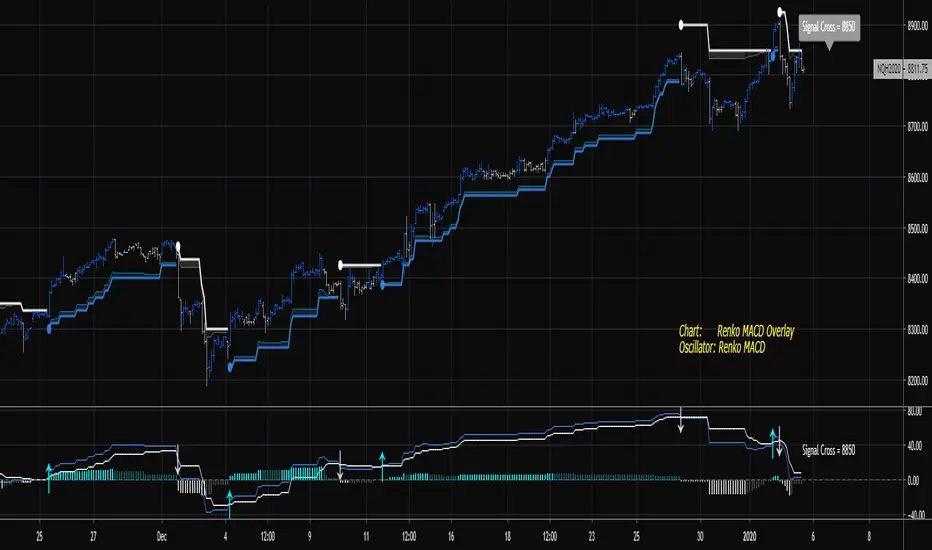
The goal of this indicator is to plot the MACD, Signal, and Histogram values "as if" the chart is a true price action based Renko chart. It can be used on a time series chart or Renko series chart. The MACD is derived from the raw price action of a time-based chart, where the historic and live price is clustered into Renko bricks. The Renko brick production algorithm is entirely backed by Renko Overlay Ribbon and thoroughly tested.
The algorithm takes into account rapid brick production within a single time candle and adjusts accordingly. The output may vary slightly between different chart time frames for the same indicator settings, but this is due to the lack of price fluctuation visibility that can occur in higher chart time frames. If the brick tick size is low, an appropriate chart interval should be selected that maximizes the amount of price volatility visible to the indicator. A bad setting would be something like a 1 tick EURUSD Renko setting on an H4 or Day chart, there simply is no way to derive the exact and ordered price fluctuations in a single candle, 1 pip at a time. A more appropriate chart time frame would be 1-5 minutes for this selected Renko brick size.
Please find the following video introduction helpful for this indicator and the Renko MACD Trend indicator:

If you are interested in the RSI-RENKO DIVINE Strategy please have a look here:

Contact me in Trading View or telegram for more information and access instructions.
Telegram: t.me/mortdiggiddy
Daily Edge: daily-edge.com
The algorithm takes into account rapid brick production within a single time candle and adjusts accordingly. The output may vary slightly between different chart time frames for the same indicator settings, but this is due to the lack of price fluctuation visibility that can occur in higher chart time frames. If the brick tick size is low, an appropriate chart interval should be selected that maximizes the amount of price volatility visible to the indicator. A bad setting would be something like a 1 tick EURUSD Renko setting on an H4 or Day chart, there simply is no way to derive the exact and ordered price fluctuations in a single candle, 1 pip at a time. A more appropriate chart time frame would be 1-5 minutes for this selected Renko brick size.
Please find the following video introduction helpful for this indicator and the Renko MACD Trend indicator:
If you are interested in the RSI-RENKO DIVINE Strategy please have a look here:
Contact me in Trading View or telegram for more information and access instructions.
Telegram: t.me/mortdiggiddy
Daily Edge: daily-edge.com
릴리즈 노트
- Added member features.
릴리즈 노트
- Updated member features.
릴리즈 노트
- Updated data gap algorithm.
- Updated alerts.
릴리즈 노트
- Updated member features.
- Fixed update interval for force close bricks.
초대 전용 스크립트
이 스크립트는 작성자가 승인한 사용자만 접근할 수 있습니다. 사용하려면 요청 후 승인을 받아야 하며, 일반적으로 결제 후에 허가가 부여됩니다. 자세한 내용은 아래 작성자의 안내를 따르거나 mortdiggiddy에게 직접 문의하세요.
트레이딩뷰는 스크립트의 작동 방식을 충분히 이해하고 작성자를 완전히 신뢰하지 않는 이상, 해당 스크립트에 비용을 지불하거나 사용하는 것을 권장하지 않습니다. 커뮤니티 스크립트에서 무료 오픈소스 대안을 찾아보실 수도 있습니다.
작성자 지시 사항
Find the edge.
Website: daily-edge.com
Twitter: twitter.com/dailyEdgeGroup
Youtube: youtube.com/c/TheDailyEdgeTradingGroup
Telegram: t.me/mortdiggiddy
Paypal: paypal.me/mortdiggiddy
Website: daily-edge.com
Twitter: twitter.com/dailyEdgeGroup
Youtube: youtube.com/c/TheDailyEdgeTradingGroup
Telegram: t.me/mortdiggiddy
Paypal: paypal.me/mortdiggiddy
면책사항
해당 정보와 게시물은 금융, 투자, 트레이딩 또는 기타 유형의 조언이나 권장 사항으로 간주되지 않으며, 트레이딩뷰에서 제공하거나 보증하는 것이 아닙니다. 자세한 내용은 이용 약관을 참조하세요.