OPEN-SOURCE SCRIPT
Inside Bars
Inside Bars Indicator
Description:
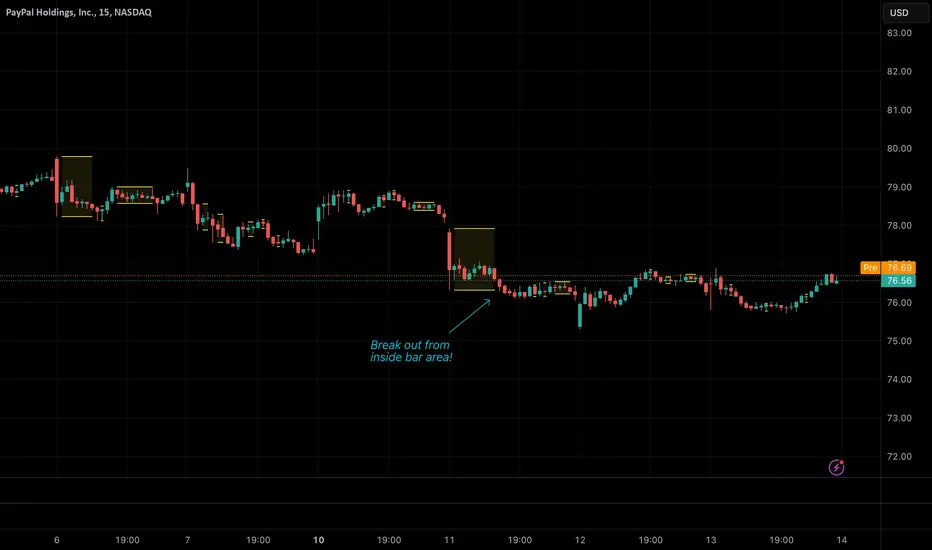
This indicator identifies and highlights price action patterns where a bar's high and low
are completely contained within the previous bar's range. Inside bars are significant
technical patterns that often signal a period of price consolidation or uncertainty,
potentially leading to a breakout in either direction.
Trading Literature & Theory:
Inside bars are well-documented in technical analysis literature:
- Steve Nison discusses them in "Japanese Candlestick Charting Techniques" as a form
of harami pattern, indicating potential trend reversals
- Thomas Bulkowski's "Encyclopedia of Chart Patterns" categorizes inside bars as
a consolidation pattern with statistical significance for breakout trading
- Alexander Elder references them in "Trading for a Living" as indicators of
decreasing volatility and potential energy build-up
- John Murphy's "Technical Analysis of the Financial Markets" includes inside bars
as part of price action analysis for market psychology understanding
The pattern is particularly significant because it represents:
1. Volatility Contraction: A narrowing of price range indicating potential energy build-up
2. Institutional Activity: Often shows large players absorbing or distributing positions
3. Decision Point: Market participants evaluating the previous bar's significance
Trading Applications:
1. Breakout Trading
- Watch for breaks above the parent bar's high (bullish signal)
- Monitor breaks below the parent bar's low (bearish signal)
- Multiple consecutive inside bars can indicate stronger breakout potential
2. Market Psychology
- Inside bars represent a period of equilibrium between buyers and sellers
- Shows market uncertainty and potential energy building up
- Often precedes significant price movements
Best Market Conditions:
- Trending markets approaching potential reversal points
- After strong momentum moves where the market needs to digest gains
- Near key support/resistance levels
- During pre-breakout consolidation phases
Complementary Indicators:
- Volume indicators to confirm breakout strength
- Trend indicators (Moving Averages, ADX) for context
- Momentum indicators (RSI, MACD) for additional confirmation
Risk Management:
- Use parent bar's range for stop loss placement
- Wait for breakout confirmation before entry
- Consider time-based exits if breakout doesn't occur
- More reliable on higher timeframes
Note: The indicator works best when combined with proper risk management
and overall market context analysis. Avoid trading every inside bar pattern
and always confirm with volume and other technical indicators.
Description:
This indicator identifies and highlights price action patterns where a bar's high and low
are completely contained within the previous bar's range. Inside bars are significant
technical patterns that often signal a period of price consolidation or uncertainty,
potentially leading to a breakout in either direction.
Trading Literature & Theory:
Inside bars are well-documented in technical analysis literature:
- Steve Nison discusses them in "Japanese Candlestick Charting Techniques" as a form
of harami pattern, indicating potential trend reversals
- Thomas Bulkowski's "Encyclopedia of Chart Patterns" categorizes inside bars as
a consolidation pattern with statistical significance for breakout trading
- Alexander Elder references them in "Trading for a Living" as indicators of
decreasing volatility and potential energy build-up
- John Murphy's "Technical Analysis of the Financial Markets" includes inside bars
as part of price action analysis for market psychology understanding
The pattern is particularly significant because it represents:
1. Volatility Contraction: A narrowing of price range indicating potential energy build-up
2. Institutional Activity: Often shows large players absorbing or distributing positions
3. Decision Point: Market participants evaluating the previous bar's significance
Trading Applications:
1. Breakout Trading
- Watch for breaks above the parent bar's high (bullish signal)
- Monitor breaks below the parent bar's low (bearish signal)
- Multiple consecutive inside bars can indicate stronger breakout potential
2. Market Psychology
- Inside bars represent a period of equilibrium between buyers and sellers
- Shows market uncertainty and potential energy building up
- Often precedes significant price movements
Best Market Conditions:
- Trending markets approaching potential reversal points
- After strong momentum moves where the market needs to digest gains
- Near key support/resistance levels
- During pre-breakout consolidation phases
Complementary Indicators:
- Volume indicators to confirm breakout strength
- Trend indicators (Moving Averages, ADX) for context
- Momentum indicators (RSI, MACD) for additional confirmation
Risk Management:
- Use parent bar's range for stop loss placement
- Wait for breakout confirmation before entry
- Consider time-based exits if breakout doesn't occur
- More reliable on higher timeframes
Note: The indicator works best when combined with proper risk management
and overall market context analysis. Avoid trading every inside bar pattern
and always confirm with volume and other technical indicators.
오픈 소스 스크립트
트레이딩뷰의 진정한 정신에 따라, 이 스크립트의 작성자는 이를 오픈소스로 공개하여 트레이더들이 기능을 검토하고 검증할 수 있도록 했습니다. 작성자에게 찬사를 보냅니다! 이 코드는 무료로 사용할 수 있지만, 코드를 재게시하는 경우 하우스 룰이 적용된다는 점을 기억하세요.
면책사항
해당 정보와 게시물은 금융, 투자, 트레이딩 또는 기타 유형의 조언이나 권장 사항으로 간주되지 않으며, 트레이딩뷰에서 제공하거나 보증하는 것이 아닙니다. 자세한 내용은 이용 약관을 참조하세요.
오픈 소스 스크립트
트레이딩뷰의 진정한 정신에 따라, 이 스크립트의 작성자는 이를 오픈소스로 공개하여 트레이더들이 기능을 검토하고 검증할 수 있도록 했습니다. 작성자에게 찬사를 보냅니다! 이 코드는 무료로 사용할 수 있지만, 코드를 재게시하는 경우 하우스 룰이 적용된다는 점을 기억하세요.
면책사항
해당 정보와 게시물은 금융, 투자, 트레이딩 또는 기타 유형의 조언이나 권장 사항으로 간주되지 않으며, 트레이딩뷰에서 제공하거나 보증하는 것이 아닙니다. 자세한 내용은 이용 약관을 참조하세요.