OPEN-SOURCE SCRIPT
Moving Average Simple Tool [OmegaTools]
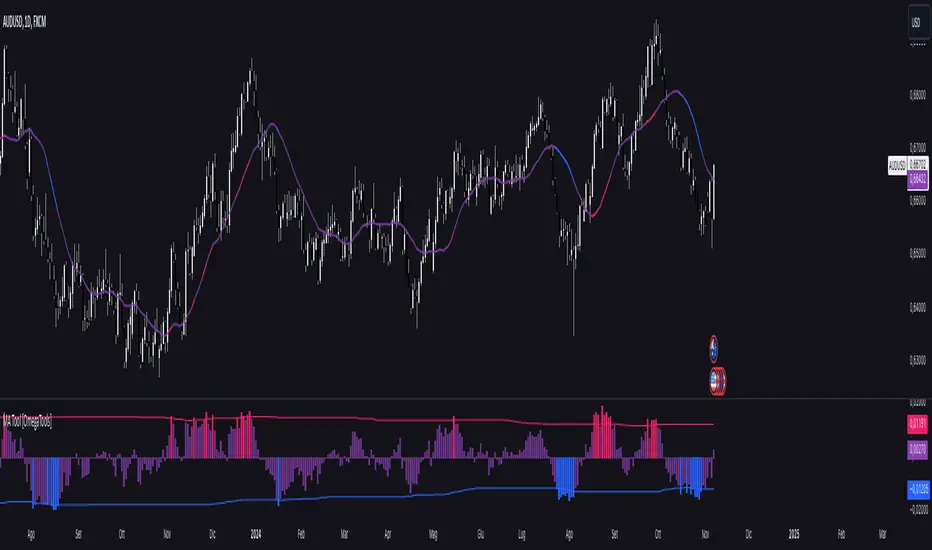
This TradingView script is a versatile Moving Average Tool that offers users multiple moving average types and a customizable overbought and oversold (OB/OS) sensitivity feature. It is designed to assist in identifying potential price trends, reversals, and momentum by using different average calculations and providing visual indicators for deviation levels. Below is a detailed breakdown of the settings, functionality, and visual elements within the Moving Average Simple Tool.
Indicator Overview
Indicator Name: Moving Average Simple Tool
Short Title: MA Tool
Purpose: Provides a choice of six moving average types with configurable sensitivity, which helps traders identify trend direction, potential reversal zones, and overbought or oversold conditions.
Input Parameters
Source (src): This option allows the user to select the data source for the moving average calculation. By default, it is set to close, but users can choose other options like open, high, low, or any custom price data.
Length (lnt): Defines the period length for the moving average. By default, it is set to 21 periods, allowing users to adjust the moving average sensitivity to either shorter or longer periods.
Average Type (mode): This input defines the moving average calculation type. Six types of averages are available:
SMA (Simple Moving Average)
EMA (Exponential Moving Average)
WMA (Weighted Moving Average)
VWMA (Volume-Weighted Moving Average)
RMA (Rolling Moving Average)
Middle Line: Calculates the average between the highest and lowest price over the period specified in Length. This is useful for a mid-range line rather than a traditional moving average.
Sensitivity (sens): This parameter controls the sensitivity of the overbought and oversold levels. The sensitivity value can range from 1 to 40, where a lower value represents a higher sensitivity and a higher value allows for smoother OB/OS zones.
Color Settings:
OS (Oversold Color, upc): The color applied to deviation areas that fall below the oversold threshold.
OB (Overbought Color, dnc): The color applied to deviation areas that exceed the overbought threshold.
Middle Line Color (midc): A gradient color that visually blends between overbought and oversold colors for smoother visual transitions.
Calculation Components
Moving Average Calculation (mu): Based on the chosen Average Type, this calculation derives the moving average or middle line value for the selected source and length.
Deviation (dev): The deviation of the source value from the moving average is calculated. This is useful to determine whether the current price is significantly above or below the average, signaling potential buying or selling opportunities.
Overbought (ob) and Oversold (os) Levels: These levels are calculated using a linear percentile interpolation based on the deviation, length, and sensitivity inputs. The higher the sensitivity, the narrower the overbought and oversold zones, allowing users to capture more frequent signals.
Visual Elements
Moving Average Line (mu): This line represents the moving average based on the selected calculation method and is plotted with a dynamic color based on deviation thresholds. When the deviation crosses into overbought or oversold zones, it shifts to the corresponding OB/OS colors, providing a visual indication of potential trend reversals.
Deviation Plot (dev): This plot visualizes the deviation values as a column plot, with colors matching the overbought, oversold, or neutral states. This helps users to quickly assess whether the price is trending or reverting back to its mean.
Overbought (ob) and Oversold (os) Levels: These levels are plotted as fixed lines, helping users identify when the deviation crosses into overbought or oversold zones.
오픈 소스 스크립트
트레이딩뷰의 진정한 정신에 따라, 이 스크립트의 작성자는 이를 오픈소스로 공개하여 트레이더들이 기능을 검토하고 검증할 수 있도록 했습니다. 작성자에게 찬사를 보냅니다! 이 코드는 무료로 사용할 수 있지만, 코드를 재게시하는 경우 하우스 룰이 적용된다는 점을 기억하세요.
면책사항
해당 정보와 게시물은 금융, 투자, 트레이딩 또는 기타 유형의 조언이나 권장 사항으로 간주되지 않으며, 트레이딩뷰에서 제공하거나 보증하는 것이 아닙니다. 자세한 내용은 이용 약관을 참조하세요.
오픈 소스 스크립트
트레이딩뷰의 진정한 정신에 따라, 이 스크립트의 작성자는 이를 오픈소스로 공개하여 트레이더들이 기능을 검토하고 검증할 수 있도록 했습니다. 작성자에게 찬사를 보냅니다! 이 코드는 무료로 사용할 수 있지만, 코드를 재게시하는 경우 하우스 룰이 적용된다는 점을 기억하세요.
면책사항
해당 정보와 게시물은 금융, 투자, 트레이딩 또는 기타 유형의 조언이나 권장 사항으로 간주되지 않으며, 트레이딩뷰에서 제공하거나 보증하는 것이 아닙니다. 자세한 내용은 이용 약관을 참조하세요.