PROTECTED SOURCE SCRIPT
Stablecoin Liquidity Delta v2 (Aggregate Market Cap Flow)
Updated version of Stablecoin Liquidity Delta (Aggregate Market Cap Flow).
Hi All,
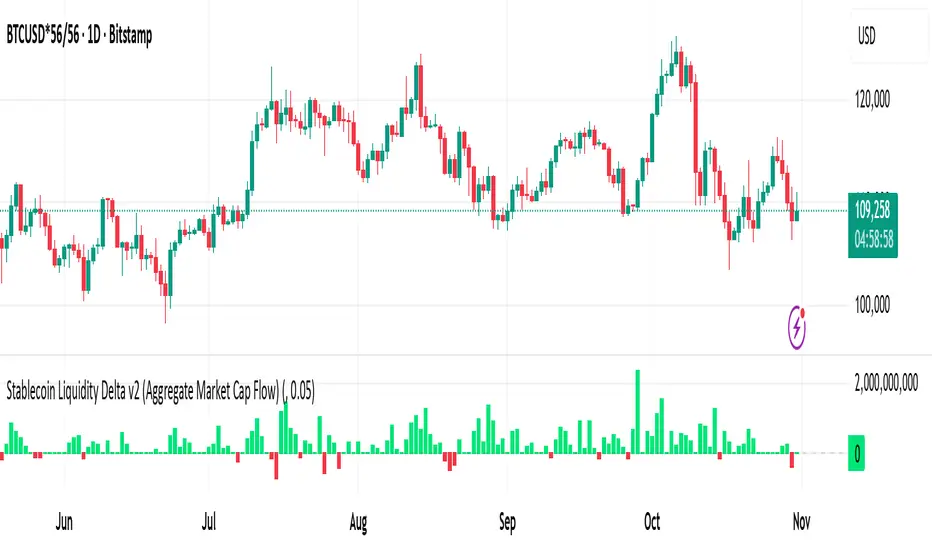
This indicator visualizes the bar-to-bar change in the aggregate market capitalization of major stablecoins, including USDT, USDC, DAI, and others. It serves as a proxy for monitoring on-chain liquidity and measuring capital inflows or outflows across the crypto market.
Stablecoins are the primary liquidity layer of the crypto economy. Their combined market capitalization acts as a mirror of the available fiat-denominated liquidity in digital markets:
🟩 An increase in the total stablecoin market capitalization indicates new issuance (capital entering the market).
🟥 A decrease reflects redemption or burning (liquidity exiting the system).
Tracking these flows helps anticipate macro-level liquidity trends that often lead overall market direction, providing context for broader price movements.
All values are derived from TradingView’s public CRYPTOCAP tickers, which represent the market capitalization of each stablecoin. While minor deviations can occur due to small price fluctuations around the $1 peg, these figures serve as a proxy for circulating supply and net issuance across the stablecoin ecosystem.
Hi All,
This indicator visualizes the bar-to-bar change in the aggregate market capitalization of major stablecoins, including USDT, USDC, DAI, and others. It serves as a proxy for monitoring on-chain liquidity and measuring capital inflows or outflows across the crypto market.
Stablecoins are the primary liquidity layer of the crypto economy. Their combined market capitalization acts as a mirror of the available fiat-denominated liquidity in digital markets:
🟩 An increase in the total stablecoin market capitalization indicates new issuance (capital entering the market).
🟥 A decrease reflects redemption or burning (liquidity exiting the system).
Tracking these flows helps anticipate macro-level liquidity trends that often lead overall market direction, providing context for broader price movements.
All values are derived from TradingView’s public CRYPTOCAP tickers, which represent the market capitalization of each stablecoin. While minor deviations can occur due to small price fluctuations around the $1 peg, these figures serve as a proxy for circulating supply and net issuance across the stablecoin ecosystem.
보호된 스크립트입니다
이 스크립트는 비공개 소스로 게시됩니다. 하지만 이를 자유롭게 제한 없이 사용할 수 있습니다 – 자세한 내용은 여기에서 확인하세요.
면책사항
해당 정보와 게시물은 금융, 투자, 트레이딩 또는 기타 유형의 조언이나 권장 사항으로 간주되지 않으며, 트레이딩뷰에서 제공하거나 보증하는 것이 아닙니다. 자세한 내용은 이용 약관을 참조하세요.
면책사항
해당 정보와 게시물은 금융, 투자, 트레이딩 또는 기타 유형의 조언이나 권장 사항으로 간주되지 않으며, 트레이딩뷰에서 제공하거나 보증하는 것이 아닙니다. 자세한 내용은 이용 약관을 참조하세요.