OPEN-SOURCE SCRIPT
업데이트됨 Seasonality and Presidential cycle

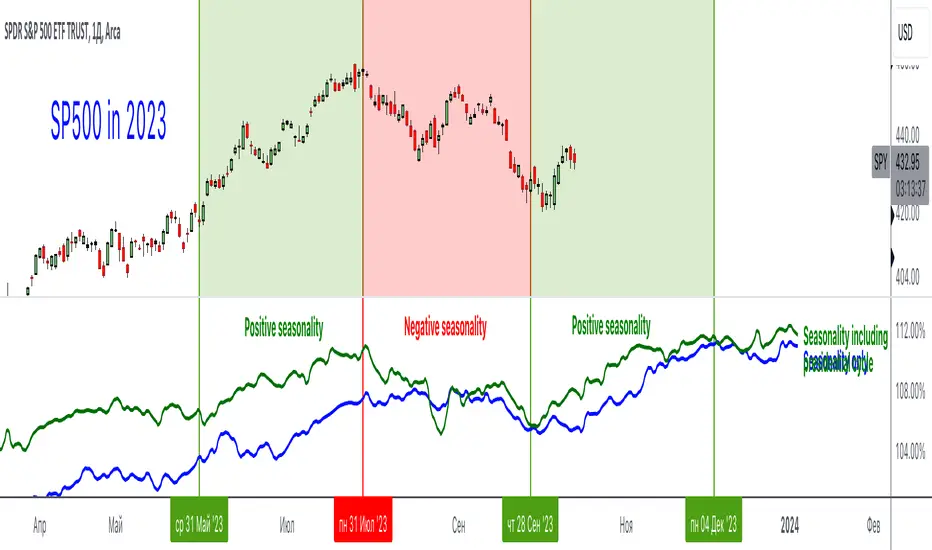
An incredibly useful indicator that shows seasonality and presidential cycles by indices, stocks and industries. Just type in a ticker and trade according to seasonal patterns
Blue line - seasonality excluding presidential cycles
Green line - seasonality taking into account presidential cycles
*Seasonal patterns over the last 10 years
This indicator uses the request.seed() function.
Requests data from a GitHub repository maintained by our team and returns it as a series.
Pine Seeds is a service to import custom data and access it via TradingView.
Use TradingView as frontend and use a GitHub repository as backend.
github.com/tradingview-pine-seeds/docs
...
Rus: Невероятно полезный индикатор, который показывает сезонность и президентские циклы по индексам, акциям и отраслям. Просто вбейте тикер и торгуйте согласно сезонным паттернам
Синяя линия - сезонность без учета президентских циклов
Зеленая линия - сезонность с учетом президентских циклов
*Сезонные паттерны за последние 10 лет
릴리즈 노트
New demo chart릴리즈 노트
New chart릴리즈 노트
New chart릴리즈 노트
New chart릴리즈 노트
New chart릴리즈 노트
New chart릴리즈 노트
New chart릴리즈 노트
New chart, some bugs fixed릴리즈 노트
New chart릴리즈 노트
Bugs fixed릴리즈 노트
New code릴리즈 노트
Data for 2024 릴리즈 노트
More tickers릴리즈 노트
Monthly seasonality릴리즈 노트
Seasonal patterns (new)릴리즈 노트
Bugs fixed릴리즈 노트
Seasonality and Presidential cycle for 2025릴리즈 노트
Optimized and improved loading speed오픈 소스 스크립트
트레이딩뷰의 진정한 정신에 따라, 이 스크립트의 작성자는 이를 오픈소스로 공개하여 트레이더들이 기능을 검토하고 검증할 수 있도록 했습니다. 작성자에게 찬사를 보냅니다! 이 코드는 무료로 사용할 수 있지만, 코드를 재게시하는 경우 하우스 룰이 적용된다는 점을 기억하세요.
면책사항
해당 정보와 게시물은 금융, 투자, 트레이딩 또는 기타 유형의 조언이나 권장 사항으로 간주되지 않으며, 트레이딩뷰에서 제공하거나 보증하는 것이 아닙니다. 자세한 내용은 이용 약관을 참조하세요.
오픈 소스 스크립트
트레이딩뷰의 진정한 정신에 따라, 이 스크립트의 작성자는 이를 오픈소스로 공개하여 트레이더들이 기능을 검토하고 검증할 수 있도록 했습니다. 작성자에게 찬사를 보냅니다! 이 코드는 무료로 사용할 수 있지만, 코드를 재게시하는 경우 하우스 룰이 적용된다는 점을 기억하세요.
면책사항
해당 정보와 게시물은 금융, 투자, 트레이딩 또는 기타 유형의 조언이나 권장 사항으로 간주되지 않으며, 트레이딩뷰에서 제공하거나 보증하는 것이 아닙니다. 자세한 내용은 이용 약관을 참조하세요.