PROTECTED SOURCE SCRIPT
[DEM] Sequential Identifying Table
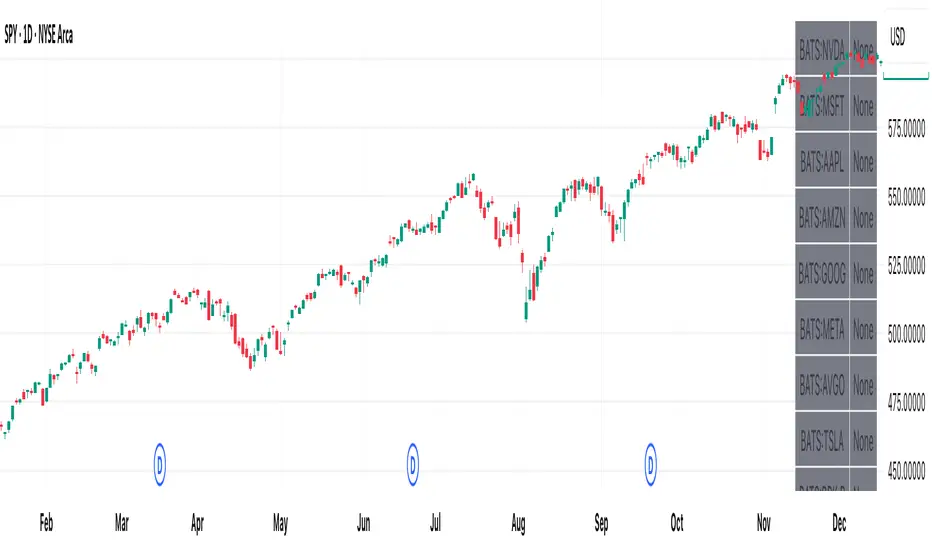
[DEM] Sequential Identifying Table is designed to monitor Sequential methodology across up to 20 customizable symbols simultaneously, displaying buy and sell signals in a comprehensive dashboard format overlaid on the price chart. The indicator implements a sequential counting system, which tracks consecutive closes above or below the close from four periods ago, generating buy signals when a downward sequence reaches 8 (indicating potential exhaustion and reversal upward) and sell signals when an upward sequence reaches 8 (indicating potential exhaustion and reversal downward). The table displays each symbol with color-coded backgrounds (green for buy signals, red for sell signals, gray for no signal) and corresponding signal text, operating on a selectable timeframe from 1-minute to monthly intervals, allowing traders to quickly scan multiple assets for sequential setups without switching between different charts or timeframes.
보호된 스크립트입니다
이 스크립트는 비공개 소스로 게시됩니다. 하지만 제한 없이 자유롭게 사용할 수 있습니다 — 여기에서 자세히 알아보기.
면책사항
이 정보와 게시물은 TradingView에서 제공하거나 보증하는 금융, 투자, 거래 또는 기타 유형의 조언이나 권고 사항을 의미하거나 구성하지 않습니다. 자세한 내용은 이용 약관을 참고하세요.
보호된 스크립트입니다
이 스크립트는 비공개 소스로 게시됩니다. 하지만 제한 없이 자유롭게 사용할 수 있습니다 — 여기에서 자세히 알아보기.
면책사항
이 정보와 게시물은 TradingView에서 제공하거나 보증하는 금융, 투자, 거래 또는 기타 유형의 조언이나 권고 사항을 의미하거나 구성하지 않습니다. 자세한 내용은 이용 약관을 참고하세요.