OPEN-SOURCE SCRIPT
업데이트됨 Fibo Candle Middle Line
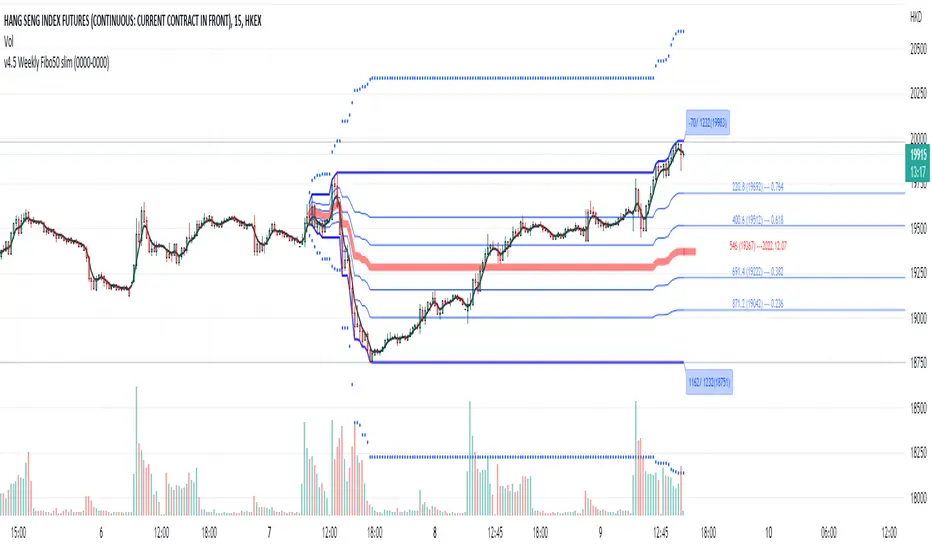
Adopt the idea of Fibo retracement 50% line, if a retracement move more than 50%, it is likely that the retracement will continue and made a new high or new low with 1.618 ratio from the middle line. You will find that the fibo 50% line also works as a support and resistance. The Dotted line is the projected 1.618 fibo target.
릴리즈 노트
The blue line is the fibo 50% middle line of a day candle. When bull and bear fight, the forming of bear and bull, need to break the Fibo 50% line first, once it break, the winning party will go to the 1.618 target line. To use this indicator, you can observe how it react at the middle line, if it win, you may set your take profit point as at te dotted line (1.618) at the time of rebound. 릴리즈 노트
Highlight functionYou can adjust the range of the fibo by clicking the indicator on the chart as well as using the indicator set up to input the begin date/time.
I find the dragging on the chart to adjust begin date/time is very useful
How to use?
1. Select the indicator on the chart
2. Move the mouse to the "square" symbol at the begining of the period
3. You can drag to change the begin date/time
오픈 소스 스크립트
트레이딩뷰의 진정한 정신에 따라, 이 스크립트의 작성자는 이를 오픈소스로 공개하여 트레이더들이 기능을 검토하고 검증할 수 있도록 했습니다. 작성자에게 찬사를 보냅니다! 이 코드는 무료로 사용할 수 있지만, 코드를 재게시하는 경우 하우스 룰이 적용된다는 점을 기억하세요.
면책사항
해당 정보와 게시물은 금융, 투자, 트레이딩 또는 기타 유형의 조언이나 권장 사항으로 간주되지 않으며, 트레이딩뷰에서 제공하거나 보증하는 것이 아닙니다. 자세한 내용은 이용 약관을 참조하세요.
오픈 소스 스크립트
트레이딩뷰의 진정한 정신에 따라, 이 스크립트의 작성자는 이를 오픈소스로 공개하여 트레이더들이 기능을 검토하고 검증할 수 있도록 했습니다. 작성자에게 찬사를 보냅니다! 이 코드는 무료로 사용할 수 있지만, 코드를 재게시하는 경우 하우스 룰이 적용된다는 점을 기억하세요.
면책사항
해당 정보와 게시물은 금융, 투자, 트레이딩 또는 기타 유형의 조언이나 권장 사항으로 간주되지 않으며, 트레이딩뷰에서 제공하거나 보증하는 것이 아닙니다. 자세한 내용은 이용 약관을 참조하세요.