OPEN-SOURCE SCRIPT
업데이트됨 Moving Average Toolkit
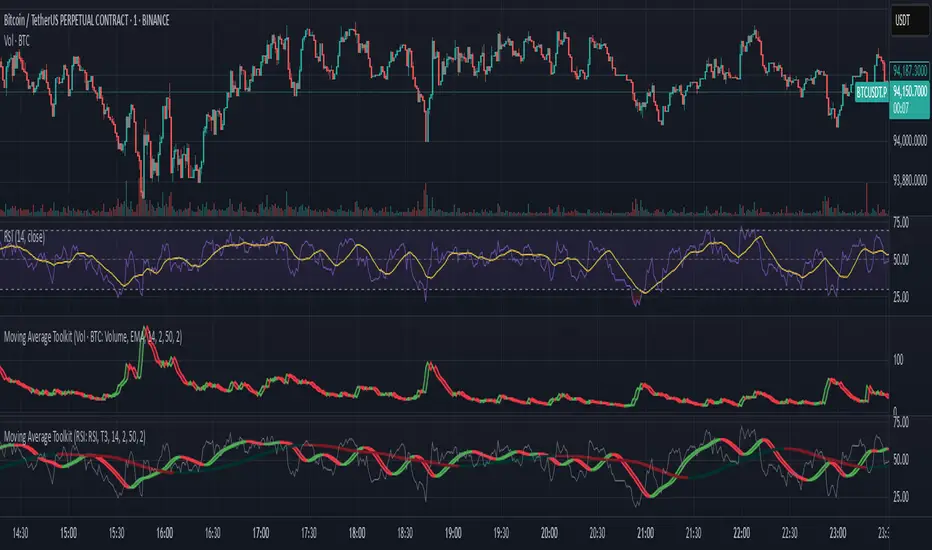
Moving Average Toolkit - Advanced MA Analysis with Flexible Source Input
A powerful and versatile moving average indicator designed for maximum flexibility. Its unique source input feature allows you to analyze moving averages of ANY indicator or price data, making it perfect for creating custom combinations with RSI, Volume, OBV, or any other technical indicator.
Key Features:
• Universal Source Input:
- Analyze moving averages of any data: Price, Volume, RSI, MACD, Custom Indicators
- Perfect for creating advanced technical setups
- Identify trends in any technical data
• 13 Moving Average Types:
- Traditional: SMA, EMA, WMA, RMA, VWMA
- Advanced: HMA, T3, DEMA, TEMA, KAMA, ZLEMA, McGinley, EPMA
• Dual MA System:
- Compare two different moving averages
- Independent settings for each MA
- Perfect for multiple timeframe analysis
• Visual Offset Analysis:
- Dynamic color changes based on momentum
- Fill between current and offset values
- Clear visualization of trend strength
Usage Examples:
• Price Trend: Traditional MA analysis using price data
• Volume Trend: Apply MA to volume for volume trend analysis
• RSI Trend: Smooth RSI movements for clearer signals
• Custom: Apply to any indicator output for unique insights
Settings:
• Fully customizable colors for bull/bear conditions
• Adjustable offset periods
• Independent length settings
• Optional second MA for comparison
Perfect for:
• Advanced technical analysts
• Multi-indicator strategy developers
• Custom indicator creators
• Traders seeking flexible analysis tools
This versatile toolkit goes beyond traditional moving averages by allowing you to apply sophisticated MA analysis to any technical data, creating endless possibilities for custom technical analysis strategies.
릴리즈 노트
Add option to plot source of moving average릴리즈 노트
Update chart preview릴리즈 노트
Update chart privew릴리즈 노트
These 3 hidden plots have been added to the indicator so you can use them as sources in other indicators:- MA1 Delta: Calculates the difference between MA1 and its offset
- MA2 Delta: Calculates the difference between MA2 and its offset
- MA1 - MA2: Calculates the difference between MA1 and MA2
With this change, you have more flexibility to create complex indicators without coding.
For example, we can recreate the MACD indicator by using this indicator twice.
First indicator:
Source: close
MA Type: EMA
MA1 Length: 12
MA2 Length: 26
Second indicator:
Source: "MATK: MA1 - MA2"
MA Type: EMA
MA1 Length: 9
As you can see, the lines in the second indicator match exactly what we see in a standard MACD indicator.
오픈 소스 스크립트
트레이딩뷰의 진정한 정신에 따라, 이 스크립트의 작성자는 이를 오픈소스로 공개하여 트레이더들이 기능을 검토하고 검증할 수 있도록 했습니다. 작성자에게 찬사를 보냅니다! 이 코드는 무료로 사용할 수 있지만, 코드를 재게시하는 경우 하우스 룰이 적용된다는 점을 기억하세요.
면책사항
해당 정보와 게시물은 금융, 투자, 트레이딩 또는 기타 유형의 조언이나 권장 사항으로 간주되지 않으며, 트레이딩뷰에서 제공하거나 보증하는 것이 아닙니다. 자세한 내용은 이용 약관을 참조하세요.
오픈 소스 스크립트
트레이딩뷰의 진정한 정신에 따라, 이 스크립트의 작성자는 이를 오픈소스로 공개하여 트레이더들이 기능을 검토하고 검증할 수 있도록 했습니다. 작성자에게 찬사를 보냅니다! 이 코드는 무료로 사용할 수 있지만, 코드를 재게시하는 경우 하우스 룰이 적용된다는 점을 기억하세요.
면책사항
해당 정보와 게시물은 금융, 투자, 트레이딩 또는 기타 유형의 조언이나 권장 사항으로 간주되지 않으며, 트레이딩뷰에서 제공하거나 보증하는 것이 아닙니다. 자세한 내용은 이용 약관을 참조하세요.