OPEN-SOURCE SCRIPT
Racer Correlation [racer8]
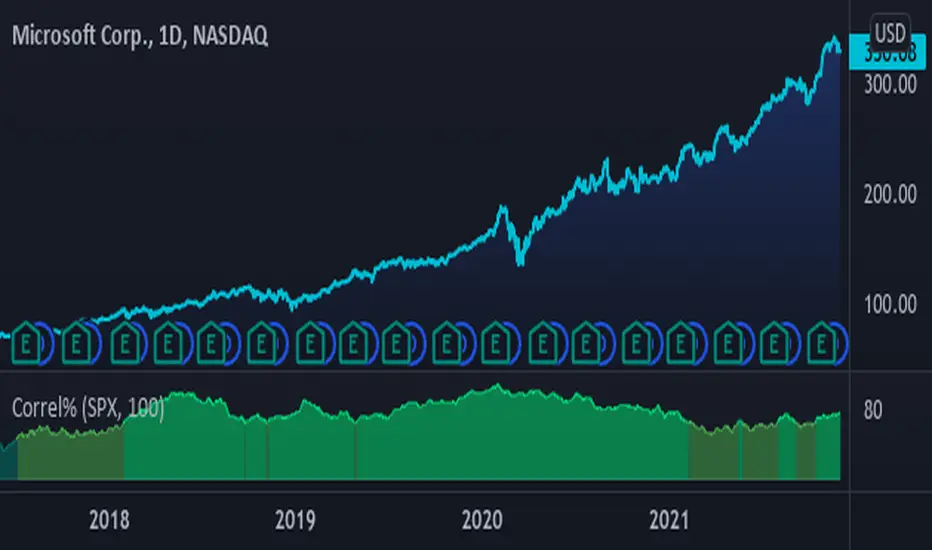
This indicator gauges correlation between 2 markets using my own method I invented. It is far superior to the correlation coefficient in that it maintains steady correlation values, meaning less false signals regarding correlation. Yet, the indicator's calculation is very simple in fact...
It simply calculates the percentage of moves in the same direction as the other market. So if MSFT moved in the same direction as SPX 80% of the time, then the indicator would show you a value of 80. Unlike correlation coefficient, you can calculate exactly how many of MSFT's bars moved in the same direction as SPX's bars. Everytime MSFT moves in the same direction as SPX, it is included in the percentage of positively correlated moves.
Closing prices are used solely in the indicator's calculations. All indicator values represent a percentage. Also, I recommend a length of at least 100 periods.
Values between 0% and 25% indicate strong negative correlation. (bright red)
Values between 25% and 33% indicate moderate negative correlation. (red)
Values between 33% and 50% indicate weak negative correlation. (dark red)
Values between 50% and 67% indicate weak positive correlation. (dark green)
Values between 67% and 75% indicate moderate positive correlation. (green)
Values between 75% and 100% indicate strong positive correlation. (bright green)........Enjoy :)
오픈 소스 스크립트
트레이딩뷰의 진정한 정신에 따라, 이 스크립트의 작성자는 이를 오픈소스로 공개하여 트레이더들이 기능을 검토하고 검증할 수 있도록 했습니다. 작성자에게 찬사를 보냅니다! 이 코드는 무료로 사용할 수 있지만, 코드를 재게시하는 경우 하우스 룰이 적용된다는 점을 기억하세요.
면책사항
해당 정보와 게시물은 금융, 투자, 트레이딩 또는 기타 유형의 조언이나 권장 사항으로 간주되지 않으며, 트레이딩뷰에서 제공하거나 보증하는 것이 아닙니다. 자세한 내용은 이용 약관을 참조하세요.
오픈 소스 스크립트
트레이딩뷰의 진정한 정신에 따라, 이 스크립트의 작성자는 이를 오픈소스로 공개하여 트레이더들이 기능을 검토하고 검증할 수 있도록 했습니다. 작성자에게 찬사를 보냅니다! 이 코드는 무료로 사용할 수 있지만, 코드를 재게시하는 경우 하우스 룰이 적용된다는 점을 기억하세요.
면책사항
해당 정보와 게시물은 금융, 투자, 트레이딩 또는 기타 유형의 조언이나 권장 사항으로 간주되지 않으며, 트레이딩뷰에서 제공하거나 보증하는 것이 아닙니다. 자세한 내용은 이용 약관을 참조하세요.