OPEN-SOURCE SCRIPT
Romantic Information Coefficient

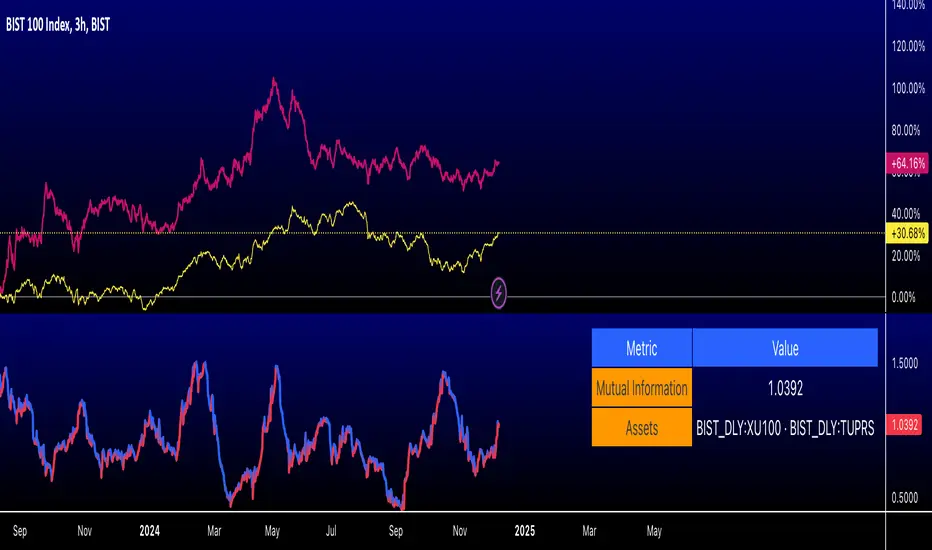
This script calculates the Mutual Information (MI) between the closing prices of two assets over a defined lookback period. Mutual Information is a measure of the shared information between two time-series datasets. A higher MI indicates a stronger relationship between the two assets.
Key Features:
Only for educational purposes. Not in anyway, investment advice.
Key Features:
- Ticker Inputs: You can select the tickers for two assets. For example, SPY (S&P 500 ETF) and AAPL (Apple stock) can be compared.
- Lookback Period: Choose the number of bars to look back and calculate the Mutual Information. A larger lookback period incorporates more data, but may be less responsive to recent price changes.
- Bins for Discretization: Control the level of granularity for discretizing the asset prices. More bins result in a more detailed MI calculation but can also reduce the signal-to-noise ratio.
- Color Coded MI: The MI plot dynamically changes color to provide visual feedback on whether the relationship between the two assets is strengthening (red) or weakening (blue).
Only for educational purposes. Not in anyway, investment advice.
오픈 소스 스크립트
트레이딩뷰의 진정한 정신에 따라, 이 스크립트의 작성자는 이를 오픈소스로 공개하여 트레이더들이 기능을 검토하고 검증할 수 있도록 했습니다. 작성자에게 찬사를 보냅니다! 이 코드는 무료로 사용할 수 있지만, 코드를 재게시하는 경우 하우스 룰이 적용된다는 점을 기억하세요.
면책사항
해당 정보와 게시물은 금융, 투자, 트레이딩 또는 기타 유형의 조언이나 권장 사항으로 간주되지 않으며, 트레이딩뷰에서 제공하거나 보증하는 것이 아닙니다. 자세한 내용은 이용 약관을 참조하세요.
오픈 소스 스크립트
트레이딩뷰의 진정한 정신에 따라, 이 스크립트의 작성자는 이를 오픈소스로 공개하여 트레이더들이 기능을 검토하고 검증할 수 있도록 했습니다. 작성자에게 찬사를 보냅니다! 이 코드는 무료로 사용할 수 있지만, 코드를 재게시하는 경우 하우스 룰이 적용된다는 점을 기억하세요.
면책사항
해당 정보와 게시물은 금융, 투자, 트레이딩 또는 기타 유형의 조언이나 권장 사항으로 간주되지 않으며, 트레이딩뷰에서 제공하거나 보증하는 것이 아닙니다. 자세한 내용은 이용 약관을 참조하세요.