OPEN-SOURCE SCRIPT
업데이트됨 ADX+ Oscillator
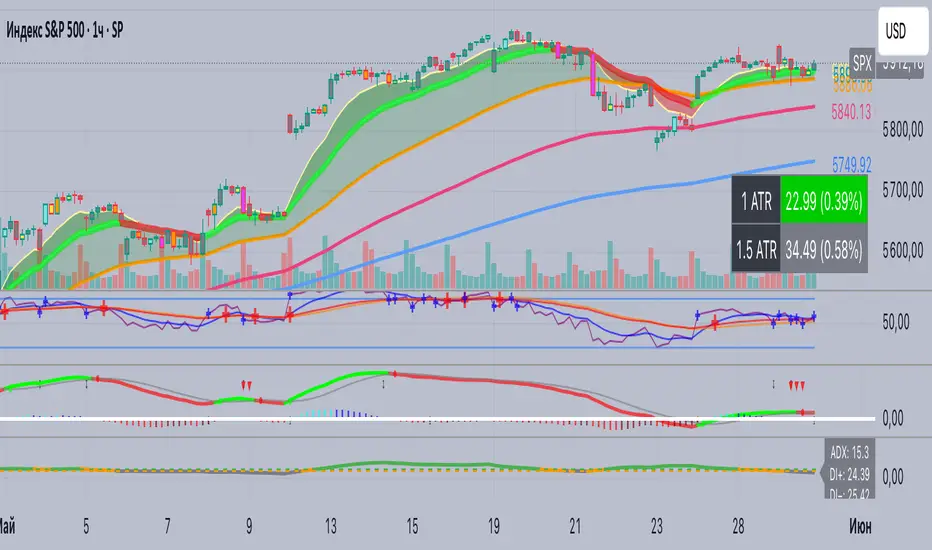
📈 ADX+ Oscillator — Enhanced Trend Strength Indicator
🔹 Description:
A modified oscillator based on the ADX (Average Directional Index), providing both visual and digital interpretation of trend strength and direction. A powerful tool for filtering sideways markets and identifying strong impulses across any timeframe.
🔹 Features:
• ADX line to assess trend strength
• DI+ and DI− lines to determine trend direction
• Colored background zones:
• Gray: ranging market (ADX < 20)
• Orange: transition zone (20 ≤ ADX < 25)
• Green: strong trend (ADX ≥ 25)
• Digital value labels for ADX / DI+ / DI− on the latest candle
• Signal arrows when DI+ crosses DI− and vice versa
🔹 Why use it:
• Signal filtering: avoid trades in flat markets (ADX < 20)
• Trend confirmation: enter only when ADX is rising above 25
• Directional guidance via DI+ and DI− behavior
🔹 Best for:
• Scalping (1m, 5m)
• Intraday trading (15m, 1h)
• Swing trading (4h and above)
• Breakout and pullback strategies
릴리즈 노트
📈 ADX+ Oscillator — Enhanced Trend Strength Indicator🔹 Description:
A modified oscillator based on the ADX (Average Directional Index), providing both visual and digital interpretation of trend strength and direction. A powerful tool for filtering sideways markets and identifying strong impulses across any timeframe.
🔹 Features:
• ADX line to assess trend strength
• DI+ and DI− lines to determine trend direction
• Colored background zones:
• Gray: ranging market (ADX < 20)
• Orange: transition zone (20 ≤ ADX < 25)
• Green: strong trend (ADX ≥ 25)
• Digital value labels for ADX / DI+ / DI− on the latest candle
• Signal arrows when DI+ crosses DI− and vice versa
🔹 Why use it:
• Signal filtering: avoid trades in flat markets (ADX < 20)
• Trend confirmation: enter only when ADX is rising above 25
• Directional guidance via DI+ and DI− behavior
🔹 Best for:
• Scalping (1m, 5m)
• Intraday trading (15m, 1h)
• Swing trading (4h and above)
• Breakout and pullback strategies
오픈 소스 스크립트
트레이딩뷰의 진정한 정신에 따라, 이 스크립트의 작성자는 이를 오픈소스로 공개하여 트레이더들이 기능을 검토하고 검증할 수 있도록 했습니다. 작성자에게 찬사를 보냅니다! 이 코드는 무료로 사용할 수 있지만, 코드를 재게시하는 경우 하우스 룰이 적용된다는 점을 기억하세요.
면책사항
해당 정보와 게시물은 금융, 투자, 트레이딩 또는 기타 유형의 조언이나 권장 사항으로 간주되지 않으며, 트레이딩뷰에서 제공하거나 보증하는 것이 아닙니다. 자세한 내용은 이용 약관을 참조하세요.
오픈 소스 스크립트
트레이딩뷰의 진정한 정신에 따라, 이 스크립트의 작성자는 이를 오픈소스로 공개하여 트레이더들이 기능을 검토하고 검증할 수 있도록 했습니다. 작성자에게 찬사를 보냅니다! 이 코드는 무료로 사용할 수 있지만, 코드를 재게시하는 경우 하우스 룰이 적용된다는 점을 기억하세요.
면책사항
해당 정보와 게시물은 금융, 투자, 트레이딩 또는 기타 유형의 조언이나 권장 사항으로 간주되지 않으며, 트레이딩뷰에서 제공하거나 보증하는 것이 아닙니다. 자세한 내용은 이용 약관을 참조하세요.