INVITE-ONLY SCRIPT
PairTradingSignals
Pair Trading Signals (PTS)
This indicator implements a mean-reversion strategy for pairs trading, focusing on divergences between the chart's primary symbol (e.g., QQQ for tech exposure) and a user-specified inverse or correlated secondary symbol (default: SPY for broad market proxy). It generates long-only entry and exit signals on the primary asset based on statistical deviations in their relative pricing, without requiring short positions or direct trading of the secondary symbol.
Core Concepts
Pairs Mean Reversion: The strategy exploits temporary mispricings in cointegrated assets. When the primary asset becomes "cheap" relative to the secondary (oversold spread), it enters a long position expecting convergence. Exits occur when the spread reverts to neutral or overbought levels.
Spread & Z-Score: The raw spread is calculated as Primary Close - (Hedge Ratio × Secondary Close), with a fixed hedge ratio of 1.5 to approximate relative volatility (e.g., beta adjustment). This is normalized to a Z-score over a lookback period, measuring deviations in standard deviations from the historical mean. Bounds (default ±2.0) define oversold/overbought thresholds—common in statistical arbitrage for 95% confidence intervals assuming normality.
ATR-Based Risk Controls: Entry levels incorporate Average True Range (ATR, default 14-period RMA smoothing) to set dynamic take-profit (TP = Entry + Upper Bound × ATR) and stop-loss (SL = Entry - |Lower Bound| × ATR) levels, scaling to volatility.
Signal Logic
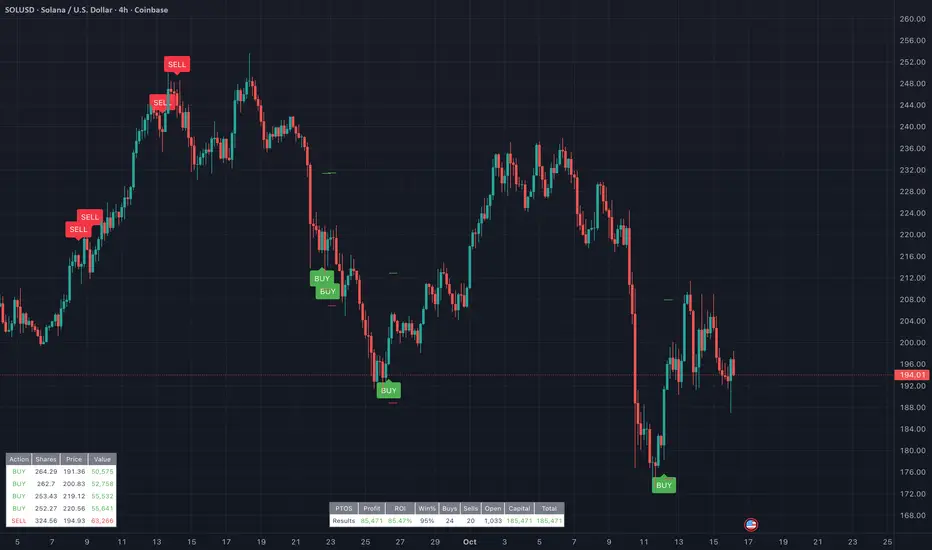
Buy (Long Entry): Triggers when the Z-score crosses above the lower bound (-2.0) after entering an oversold state (Z < lower bound). This signals undervaluation of the primary relative to the secondary.
Sell (Exit): Triggers when the Z-score crosses below the upper bound (2.0) after entering an overbought state (Z > upper bound). Optional strict TP/SL enforcement closes positions at predefined levels.
Signals appear as labeled shapes (green BUY below bar, red SELL above). Short horizontal boxes mark TP (green) and SL (red) for visual reference.
Backtesting & Performance Metrics
Simulation Period: Trades only within user-defined start/end dates (default: Jan 2020–Dec 2030).
Position Sizing: Fixed allocation based on initial capital × entry percentage (default 100%), capped by available equity to enforce risk limits. Supports full compounding if desired via code tweak.
Metrics Table: Displays net profit, ROI (including/excluding unrealized P&L), win rate, trade counts, closed capital, total equity, and open position details (shares or current value). Recent trades logged in a separate table.
Equity Floor: Prevents capital from going below zero, simulating real-world drawdown limits.
Usage Guidelines
Symbol Setup: Apply to the primary asset's chart (e.g., QQQ). Set "Inverse Ticker" to a negatively or positively correlated pair (e.g., SPY for market hedge).
Parameter Tuning: Increase lookback (20+) for smoother signals; widen bounds (±3.0) for fewer, higher-conviction trades. Lower entry % reduces risk.
Best Practices: Use on daily/4H timeframes for swing trades. Combine with overall market trend filters. Backtest across regimes (e.g., bull/bear) to validate.
Limitations: Assumes mean reversion holds; performs poorly in trending divergences. No commissions/slippage modeled—adjust initial capital accordingly.
This approach draws from classic pairs trading literature (e.g., Gatev et al.'s distance method), adapted for single-asset execution via Z-score thresholds. For optimal results, ensure the pair exhibits cointegration (test via Engle-Granger if customizing).
This indicator implements a mean-reversion strategy for pairs trading, focusing on divergences between the chart's primary symbol (e.g., QQQ for tech exposure) and a user-specified inverse or correlated secondary symbol (default: SPY for broad market proxy). It generates long-only entry and exit signals on the primary asset based on statistical deviations in their relative pricing, without requiring short positions or direct trading of the secondary symbol.
Core Concepts
Pairs Mean Reversion: The strategy exploits temporary mispricings in cointegrated assets. When the primary asset becomes "cheap" relative to the secondary (oversold spread), it enters a long position expecting convergence. Exits occur when the spread reverts to neutral or overbought levels.
Spread & Z-Score: The raw spread is calculated as Primary Close - (Hedge Ratio × Secondary Close), with a fixed hedge ratio of 1.5 to approximate relative volatility (e.g., beta adjustment). This is normalized to a Z-score over a lookback period, measuring deviations in standard deviations from the historical mean. Bounds (default ±2.0) define oversold/overbought thresholds—common in statistical arbitrage for 95% confidence intervals assuming normality.
ATR-Based Risk Controls: Entry levels incorporate Average True Range (ATR, default 14-period RMA smoothing) to set dynamic take-profit (TP = Entry + Upper Bound × ATR) and stop-loss (SL = Entry - |Lower Bound| × ATR) levels, scaling to volatility.
Signal Logic
Buy (Long Entry): Triggers when the Z-score crosses above the lower bound (-2.0) after entering an oversold state (Z < lower bound). This signals undervaluation of the primary relative to the secondary.
Sell (Exit): Triggers when the Z-score crosses below the upper bound (2.0) after entering an overbought state (Z > upper bound). Optional strict TP/SL enforcement closes positions at predefined levels.
Signals appear as labeled shapes (green BUY below bar, red SELL above). Short horizontal boxes mark TP (green) and SL (red) for visual reference.
Backtesting & Performance Metrics
Simulation Period: Trades only within user-defined start/end dates (default: Jan 2020–Dec 2030).
Position Sizing: Fixed allocation based on initial capital × entry percentage (default 100%), capped by available equity to enforce risk limits. Supports full compounding if desired via code tweak.
Metrics Table: Displays net profit, ROI (including/excluding unrealized P&L), win rate, trade counts, closed capital, total equity, and open position details (shares or current value). Recent trades logged in a separate table.
Equity Floor: Prevents capital from going below zero, simulating real-world drawdown limits.
Usage Guidelines
Symbol Setup: Apply to the primary asset's chart (e.g., QQQ). Set "Inverse Ticker" to a negatively or positively correlated pair (e.g., SPY for market hedge).
Parameter Tuning: Increase lookback (20+) for smoother signals; widen bounds (±3.0) for fewer, higher-conviction trades. Lower entry % reduces risk.
Best Practices: Use on daily/4H timeframes for swing trades. Combine with overall market trend filters. Backtest across regimes (e.g., bull/bear) to validate.
Limitations: Assumes mean reversion holds; performs poorly in trending divergences. No commissions/slippage modeled—adjust initial capital accordingly.
This approach draws from classic pairs trading literature (e.g., Gatev et al.'s distance method), adapted for single-asset execution via Z-score thresholds. For optimal results, ensure the pair exhibits cointegration (test via Engle-Granger if customizing).
초대 전용 스크립트
이 스크립트는 작성자가 승인한 사용자만 접근할 수 있습니다. 사용하려면 요청 후 승인을 받아야 하며, 일반적으로 결제 후에 허가가 부여됩니다. 자세한 내용은 아래 작성자의 안내를 따르거나 theshrubgardener에게 직접 문의하세요.
트레이딩뷰는 스크립트의 작동 방식을 충분히 이해하고 작성자를 완전히 신뢰하지 않는 이상, 해당 스크립트에 비용을 지불하거나 사용하는 것을 권장하지 않습니다. 커뮤니티 스크립트에서 무료 오픈소스 대안을 찾아보실 수도 있습니다.
작성자 지시 사항
Member access only, contact the Shrub on discord - https://discord.gg/xxDvh6vAwZ
면책사항
해당 정보와 게시물은 금융, 투자, 트레이딩 또는 기타 유형의 조언이나 권장 사항으로 간주되지 않으며, 트레이딩뷰에서 제공하거나 보증하는 것이 아닙니다. 자세한 내용은 이용 약관을 참조하세요.