PROTECTED SOURCE SCRIPT
업데이트됨 MTF Stochastic Dashboard
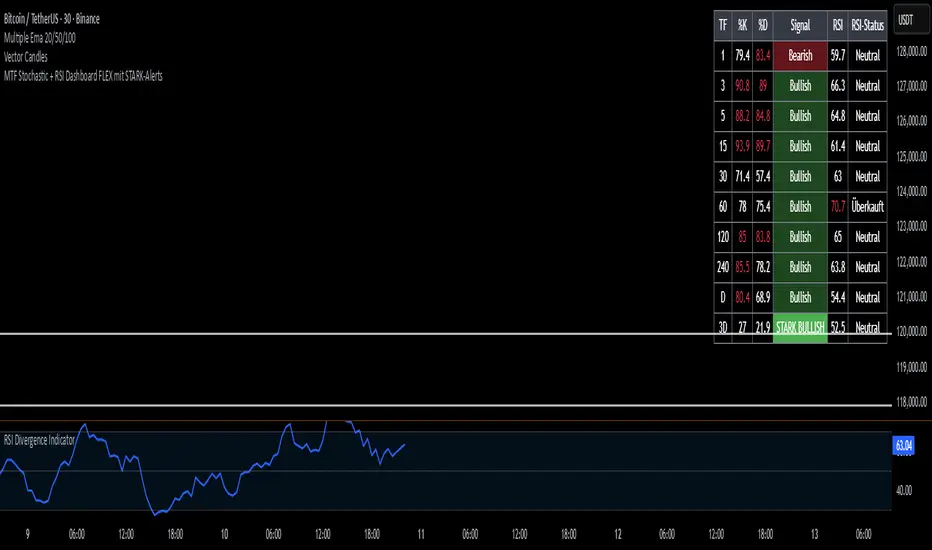
What you see:
Settings
Signal mode:
Quick presets
Settings
Signal mode:
Quick presets
릴리즈 노트
This Pine Script v6 creates a multi-timeframe dashboard that shows Stochastic (%K, %D) and RSI values across 1m–3D.Cells turn red/green when overbought/oversold.
A signal column shows Bullish / Bearish conditions based on gap/cross logic.
An extra column displays the RSI status (Overbought / Oversold / Neutral).
Would you like me to also rename headers and labels to English inside the code so the table matches this description?
릴리즈 노트
This Pine Script is a Multi-Timeframe Stochastic + RSI Dashboard with fully customizable alerts.It shows %K, %D, RSI values, and signal status for multiple timeframes in a table.
Signals are classified as Bullish / Bearish and Strong Bullish / Strong Bearish based on adjustable thresholds.
Colors for signals can be customized in the Style tab.
You can choose which timeframes to display and which ones should trigger alerts.
Alerts only fire on Strong signals, with optional RSI confirmation.
보호된 스크립트입니다
이 스크립트는 비공개 소스로 게시됩니다. 하지만 이를 자유롭게 제한 없이 사용할 수 있습니다 – 자세한 내용은 여기에서 확인하세요.
면책사항
해당 정보와 게시물은 금융, 투자, 트레이딩 또는 기타 유형의 조언이나 권장 사항으로 간주되지 않으며, 트레이딩뷰에서 제공하거나 보증하는 것이 아닙니다. 자세한 내용은 이용 약관을 참조하세요.
면책사항
해당 정보와 게시물은 금융, 투자, 트레이딩 또는 기타 유형의 조언이나 권장 사항으로 간주되지 않으며, 트레이딩뷰에서 제공하거나 보증하는 것이 아닙니다. 자세한 내용은 이용 약관을 참조하세요.