OPEN-SOURCE SCRIPT
Combined Stock Session Percent Change Monitor
Introducing the "Combined Stock Session Percent Change Monitor" - a unique tool tailored for traders who wish to track the collective performance of up to five stocks in real-time during a trading session.
Key Features:
User Customization: Easily input and monitor any five stock symbols of your choice. By default, the script tracks "AAPL", "MSFT", "AMZN", "TSLA", and "NVDA".
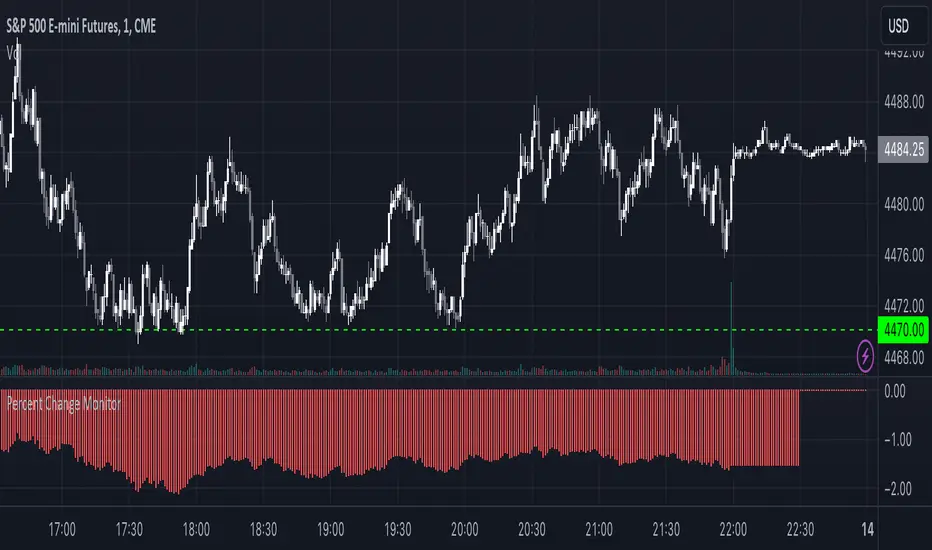
Session-Based Tracking: The script captures and calculates the percentage change from the start of a trading session, set at 15:30. This allows traders to gauge intraday performance.
Visual Clarity: The combined percentage change is plotted as columns, with green indicating a positive change and red indicating a negative change. This provides a clear, visual representation of the stocks' collective performance.
Versatility: Whether you're tracking the performance of stocks in a specific sector, or you're keeping an eye on your personal portfolio's top holdings, this tool offers a concise view of collective stock movement.
Usage:
Simply input the desired stock symbols and let the script do the rest. The plotted columns will provide a quick snapshot of how these stocks are performing collectively since the session's start.
Conclusion:
Stay ahead of the market by monitoring the combined performance of your chosen stocks. Whether you're an intraday trader or a long-term investor, this tool offers valuable insights into collective stock behavior. Happy trading!
(Note: Always conduct your own research and due diligence before making any trading decisions. This tool is meant to aid in analysis and not to serve as financial advice.)
Key Features:
User Customization: Easily input and monitor any five stock symbols of your choice. By default, the script tracks "AAPL", "MSFT", "AMZN", "TSLA", and "NVDA".
Session-Based Tracking: The script captures and calculates the percentage change from the start of a trading session, set at 15:30. This allows traders to gauge intraday performance.
Visual Clarity: The combined percentage change is plotted as columns, with green indicating a positive change and red indicating a negative change. This provides a clear, visual representation of the stocks' collective performance.
Versatility: Whether you're tracking the performance of stocks in a specific sector, or you're keeping an eye on your personal portfolio's top holdings, this tool offers a concise view of collective stock movement.
Usage:
Simply input the desired stock symbols and let the script do the rest. The plotted columns will provide a quick snapshot of how these stocks are performing collectively since the session's start.
Conclusion:
Stay ahead of the market by monitoring the combined performance of your chosen stocks. Whether you're an intraday trader or a long-term investor, this tool offers valuable insights into collective stock behavior. Happy trading!
(Note: Always conduct your own research and due diligence before making any trading decisions. This tool is meant to aid in analysis and not to serve as financial advice.)
오픈 소스 스크립트
트레이딩뷰의 진정한 정신에 따라, 이 스크립트의 작성자는 이를 오픈소스로 공개하여 트레이더들이 기능을 검토하고 검증할 수 있도록 했습니다. 작성자에게 찬사를 보냅니다! 이 코드는 무료로 사용할 수 있지만, 코드를 재게시하는 경우 하우스 룰이 적용된다는 점을 기억하세요.
면책사항
해당 정보와 게시물은 금융, 투자, 트레이딩 또는 기타 유형의 조언이나 권장 사항으로 간주되지 않으며, 트레이딩뷰에서 제공하거나 보증하는 것이 아닙니다. 자세한 내용은 이용 약관을 참조하세요.
오픈 소스 스크립트
트레이딩뷰의 진정한 정신에 따라, 이 스크립트의 작성자는 이를 오픈소스로 공개하여 트레이더들이 기능을 검토하고 검증할 수 있도록 했습니다. 작성자에게 찬사를 보냅니다! 이 코드는 무료로 사용할 수 있지만, 코드를 재게시하는 경우 하우스 룰이 적용된다는 점을 기억하세요.
면책사항
해당 정보와 게시물은 금융, 투자, 트레이딩 또는 기타 유형의 조언이나 권장 사항으로 간주되지 않으며, 트레이딩뷰에서 제공하거나 보증하는 것이 아닙니다. 자세한 내용은 이용 약관을 참조하세요.