OPEN-SOURCE SCRIPT
업데이트됨 Price Iterations with Pips
*Script Name:* Price Iterations with Pips
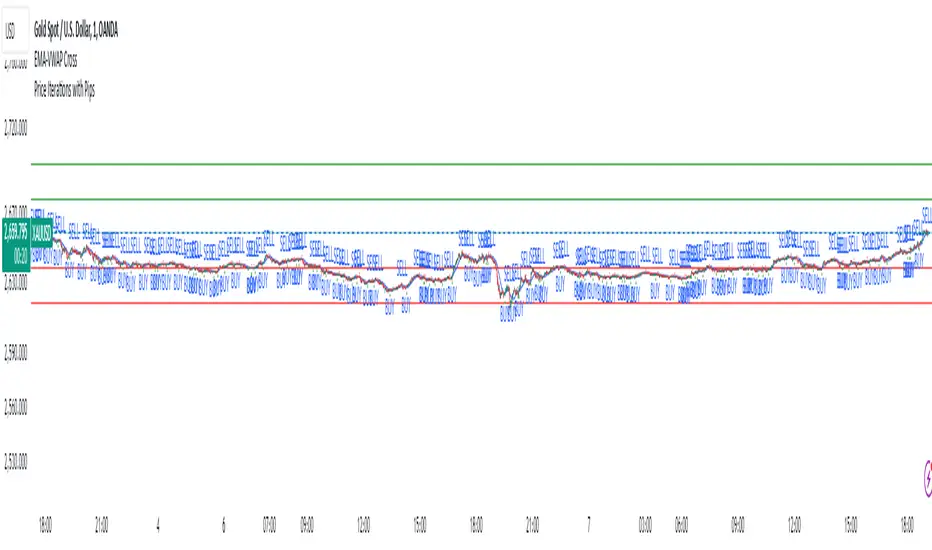
*Description:* This script plots horizontal lines above and below a user-defined initial price, representing price iterations based on a specified number of pips.
*Functionality:*
1. Asks for user input:
- Initial Price
- Pips per Iteration
- Number of Iterations
2. Calculates the price change per pip.
3. Plots horizontal lines:
- Above the initial price (green)
- Below the initial price (red)
4. Extends lines dynamically to both sides.
*Use Cases:*
1. *Support and Resistance Levels:* Use the script to visualize potential support and resistance levels based on price iterations.
2. *Price Targets:* Set the initial price as a target and use the iterations to estimate potential profit/loss levels.
3. *Risk Management:* Utilize the script to visualize risk levels based on pip iterations.
4. *Technical Analysis:* Combine the script with other technical indicators to identify potential trading opportunities.
*Trading Platforms:* This script is designed for TradingView.
*How to Use:*
1. Add the script to your TradingView chart.
2. Set the initial price, pips per iteration, and number of iterations.
3. Adjust the colors and line styles as needed.
4. Zoom in/out and pan to see the lines adjust.
*Benefits:*
1. Visualize price iterations and potential support/resistance levels.
2. Simplify risk management and price target estimation.
3. Enhance technical analysis with customizable price levels.
릴리즈 노트
I have updated the Multiplier value,Users have to Insert the current price of the Instrument and experiment with the Multiplier value and Pips per Iteration to mark the Equidistant levels from the given Initial value.
릴리즈 노트
Corrected the Mistakes in code오픈 소스 스크립트
트레이딩뷰의 진정한 정신에 따라, 이 스크립트의 작성자는 이를 오픈소스로 공개하여 트레이더들이 기능을 검토하고 검증할 수 있도록 했습니다. 작성자에게 찬사를 보냅니다! 이 코드는 무료로 사용할 수 있지만, 코드를 재게시하는 경우 하우스 룰이 적용된다는 점을 기억하세요.
면책사항
해당 정보와 게시물은 금융, 투자, 트레이딩 또는 기타 유형의 조언이나 권장 사항으로 간주되지 않으며, 트레이딩뷰에서 제공하거나 보증하는 것이 아닙니다. 자세한 내용은 이용 약관을 참조하세요.
오픈 소스 스크립트
트레이딩뷰의 진정한 정신에 따라, 이 스크립트의 작성자는 이를 오픈소스로 공개하여 트레이더들이 기능을 검토하고 검증할 수 있도록 했습니다. 작성자에게 찬사를 보냅니다! 이 코드는 무료로 사용할 수 있지만, 코드를 재게시하는 경우 하우스 룰이 적용된다는 점을 기억하세요.
면책사항
해당 정보와 게시물은 금융, 투자, 트레이딩 또는 기타 유형의 조언이나 권장 사항으로 간주되지 않으며, 트레이딩뷰에서 제공하거나 보증하는 것이 아닙니다. 자세한 내용은 이용 약관을 참조하세요.