PROTECTED SOURCE SCRIPT
Candlestick Body and Wick Midpoints [Dire]
Summary
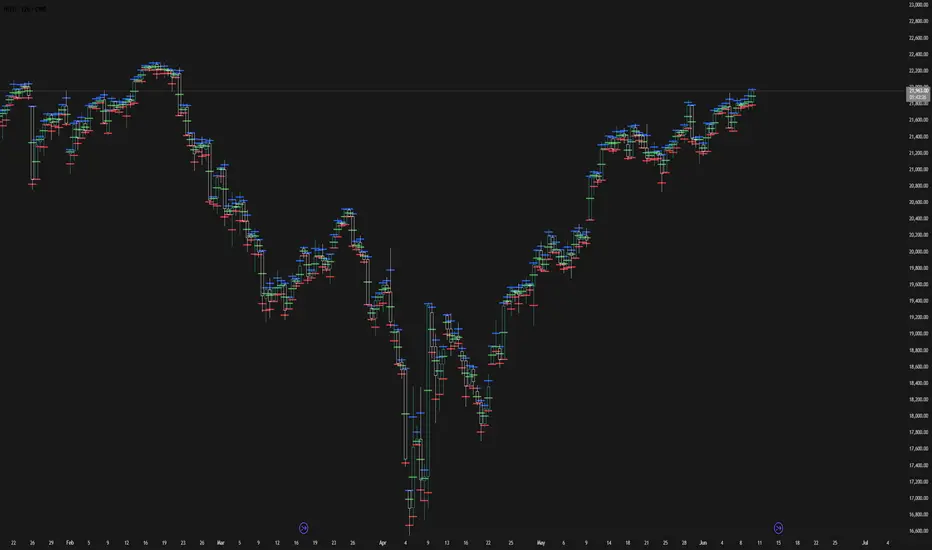
This indicator provides a deeper look into intra-bar price action by plotting the precise halfway point of each candlestick's body, top wick, and bottom wick. It renders three distinct, color-coded horizontal lines on each of the most recent candles, helping traders identify hidden micro-levels of interest.
How It Works
For each candlestick, the indicator calculates and plots:
Top Wick Midpoint: The median price of the sell-off (or profit-taking) range.
Body Midpoint: The equilibrium or "fair price" point between the open and close.
Bottom Wick Midpoint: The median price of the buy-up (or support) range.
How to Use
These levels can serve as micro-pivots or points of interest for price action analysis. A return to a previous wick's midpoint may signal a potential reaction. Observing how these levels align over several bars can reveal subtle areas of price consensus or rejection that are not obvious from standard candle charts.
Customization
Lookback Period: Easily adjust the number of recent candles to analyze via the "Inputs" tab.
Colors: The color for each of the three lines (Top Wick, Body, and Bottom Wick) can be fully customized in the "Style" tab of the indicator settings.
보호된 스크립트입니다
이 스크립트는 비공개 소스로 게시됩니다. 하지만 이를 자유롭게 제한 없이 사용할 수 있습니다 – 자세한 내용은 여기에서 확인하세요.
면책사항
해당 정보와 게시물은 금융, 투자, 트레이딩 또는 기타 유형의 조언이나 권장 사항으로 간주되지 않으며, 트레이딩뷰에서 제공하거나 보증하는 것이 아닙니다. 자세한 내용은 이용 약관을 참조하세요.
면책사항
해당 정보와 게시물은 금융, 투자, 트레이딩 또는 기타 유형의 조언이나 권장 사항으로 간주되지 않으며, 트레이딩뷰에서 제공하거나 보증하는 것이 아닙니다. 자세한 내용은 이용 약관을 참조하세요.