OPEN-SOURCE SCRIPT
Luma Signals – Orderflow Imbalance
Luma Signals – Imbalance Detector
The Luma Signals – Imbalance Detector highlights price inefficiencies where buying or selling pressure dominates, causing rapid market movements. These imbalances can act as potential support and resistance zones or indicate areas where liquidity needs to be filled.
🔹 Key Features:
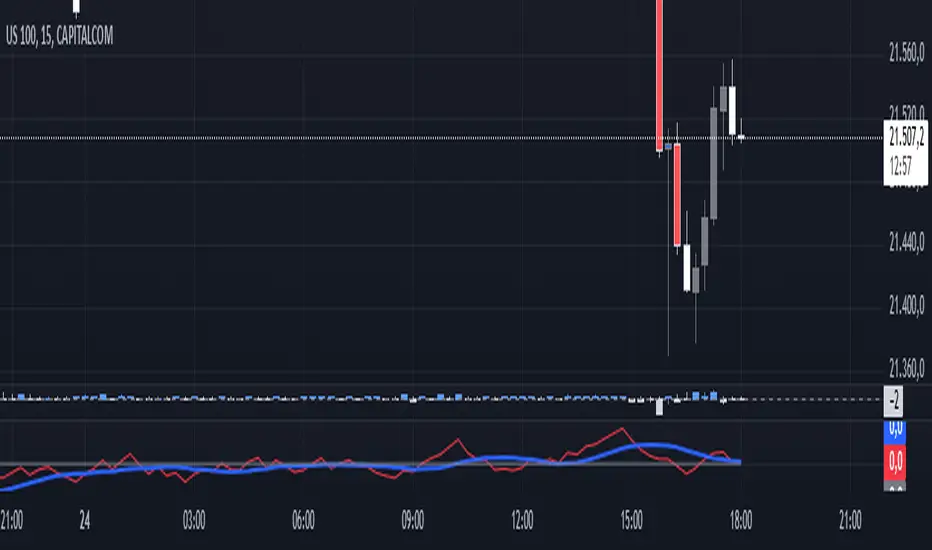
✔ Identifies Bullish & Bearish Imbalances – Blue candles indicate strong buying pressure, red candles indicate strong selling pressure.
✔ Clear Market Structure – Normal bullish candles appear in light gray, normal bearish candles in white.
✔ Dynamic Orderflow Analysis – Helps traders spot high-volatility price movements and potential reversals.
✔ No repainting & lightweight – The indicator works in real-time without altering past data.
📊 How to Use:
Trend Confirmation: If an imbalance aligns with a strong trend, it may indicate trend continuation.
Liquidity Gaps: Price often revisits imbalances before continuing its movement.
Scalping & Intraday Trading: Identify key reaction points for short-term trades.
The Luma Signals – Imbalance Detector highlights price inefficiencies where buying or selling pressure dominates, causing rapid market movements. These imbalances can act as potential support and resistance zones or indicate areas where liquidity needs to be filled.
🔹 Key Features:
✔ Identifies Bullish & Bearish Imbalances – Blue candles indicate strong buying pressure, red candles indicate strong selling pressure.
✔ Clear Market Structure – Normal bullish candles appear in light gray, normal bearish candles in white.
✔ Dynamic Orderflow Analysis – Helps traders spot high-volatility price movements and potential reversals.
✔ No repainting & lightweight – The indicator works in real-time without altering past data.
📊 How to Use:
Trend Confirmation: If an imbalance aligns with a strong trend, it may indicate trend continuation.
Liquidity Gaps: Price often revisits imbalances before continuing its movement.
Scalping & Intraday Trading: Identify key reaction points for short-term trades.
오픈 소스 스크립트
트레이딩뷰의 진정한 정신에 따라, 이 스크립트의 작성자는 이를 오픈소스로 공개하여 트레이더들이 기능을 검토하고 검증할 수 있도록 했습니다. 작성자에게 찬사를 보냅니다! 이 코드는 무료로 사용할 수 있지만, 코드를 재게시하는 경우 하우스 룰이 적용된다는 점을 기억하세요.
면책사항
해당 정보와 게시물은 금융, 투자, 트레이딩 또는 기타 유형의 조언이나 권장 사항으로 간주되지 않으며, 트레이딩뷰에서 제공하거나 보증하는 것이 아닙니다. 자세한 내용은 이용 약관을 참조하세요.
오픈 소스 스크립트
트레이딩뷰의 진정한 정신에 따라, 이 스크립트의 작성자는 이를 오픈소스로 공개하여 트레이더들이 기능을 검토하고 검증할 수 있도록 했습니다. 작성자에게 찬사를 보냅니다! 이 코드는 무료로 사용할 수 있지만, 코드를 재게시하는 경우 하우스 룰이 적용된다는 점을 기억하세요.
면책사항
해당 정보와 게시물은 금융, 투자, 트레이딩 또는 기타 유형의 조언이나 권장 사항으로 간주되지 않으며, 트레이딩뷰에서 제공하거나 보증하는 것이 아닙니다. 자세한 내용은 이용 약관을 참조하세요.