PROTECTED SOURCE SCRIPT
업데이트됨 MACD BB v2.00 Indicator CryptoPotato748
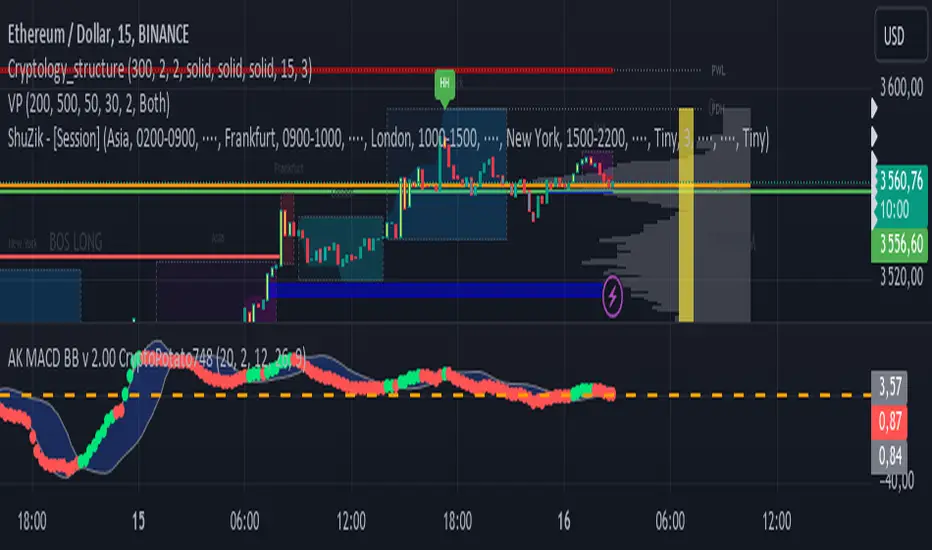
The MACD BB v2.00 CryptoPotato748 is a custom technical analysis indicator for TradingView that combines the Moving Average Convergence Divergence (MACD) with Bollinger Bands to provide a powerful tool for identifying trend strength and potential trading signals. This indicator is designed to automatically adapt its parameters based on the selected time frame, making it versatile and suitable for various trading strategies and time horizons.
Features
MACD Calculation:
The MACD line is calculated using the difference between the 12-period and 26-period Exponential Moving Averages (EMAs).
The Signal line is the 9-period EMA of the MACD line.
These parameters automatically adjust based on the selected time frame to optimize performance.
Bollinger Bands:
Bollinger Bands are calculated based on the MACD line to identify overbought and oversold conditions.
The bands consist of a 20-period Simple Moving Average (SMA) of the MACD line, with upper and lower bands set 2 standard deviations away.
These parameters also adjust based on the selected time frame for better alignment with market conditions.
Adaptive Time Frames:
The indicator automatically adjusts its MACD and Bollinger Bands parameters based on the selected chart time frame, including 1 minute, 3 minutes, 5 minutes, 15 minutes, 30 minutes, 1 hour, 2 hours, 4 hours, 12 hours, 1 day, 3 days, 1 week, and 1 month.
This ensures the indicator remains effective across various time frames without manual reconfiguration.
Visual Elements:
The upper and lower Bollinger Bands are plotted in gray, with a blue fill between them for easy visualization.
The MACD line is plotted with circle markers, colored lime when above the upper band and red when below the lower band.
A zero line is plotted in orange for reference.
Bar colors change to yellow when the MACD line is above the upper band (indicating a potential buy signal) and aqua when below the lower band (indicating a potential sell signal).
How to Use
Adding to Chart:
Copy and paste the script into the Pine Editor on TradingView.
Click "Add to Chart" to see the indicator in action.
Interpreting Signals:
MACD Above Upper Band (Lime): Indicates strong bullish momentum, potential buy signal.
MACD Below Lower Band (Red): Indicates strong bearish momentum, potential sell signal.
Yellow Bars: Suggest a potential buy condition.
Aqua Bars: Suggest a potential sell condition.
Adaptive Parameters:
The indicator automatically adjusts its parameters based on the selected time frame, ensuring optimal performance across different trading environments.
릴리즈 노트
update보호된 스크립트입니다
이 스크립트는 비공개 소스로 게시됩니다. 하지만 이를 자유롭게 제한 없이 사용할 수 있습니다 – 자세한 내용은 여기에서 확인하세요.
면책사항
해당 정보와 게시물은 금융, 투자, 트레이딩 또는 기타 유형의 조언이나 권장 사항으로 간주되지 않으며, 트레이딩뷰에서 제공하거나 보증하는 것이 아닙니다. 자세한 내용은 이용 약관을 참조하세요.
보호된 스크립트입니다
이 스크립트는 비공개 소스로 게시됩니다. 하지만 이를 자유롭게 제한 없이 사용할 수 있습니다 – 자세한 내용은 여기에서 확인하세요.
면책사항
해당 정보와 게시물은 금융, 투자, 트레이딩 또는 기타 유형의 조언이나 권장 사항으로 간주되지 않으며, 트레이딩뷰에서 제공하거나 보증하는 것이 아닙니다. 자세한 내용은 이용 약관을 참조하세요.