OPEN-SOURCE SCRIPT
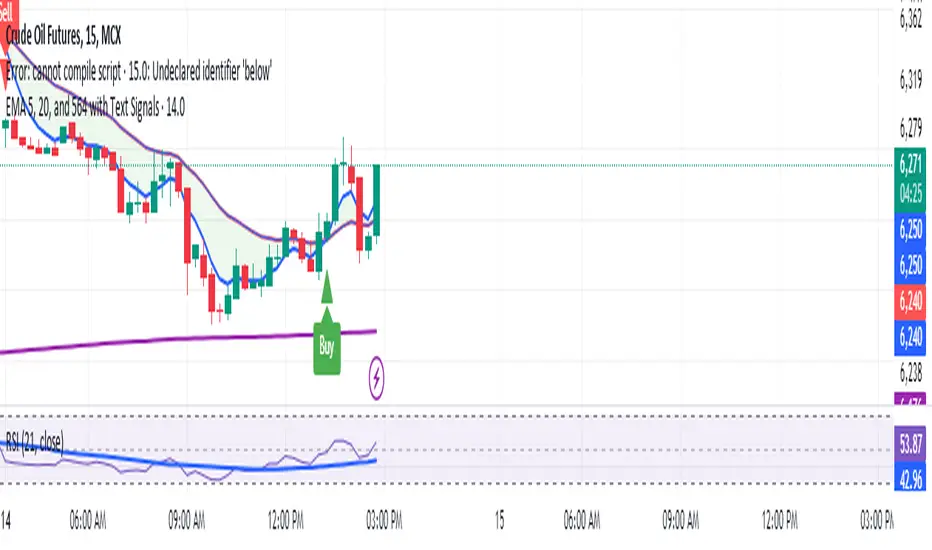
Manoj Personal EMA 5-20

3 EMA Trading Strategy Script Overview:
EMAs Used:
5 EMA: Short-term moving average.
20 EMA: Medium-term moving average.
564 EMA: Long-term moving average to identify overall trend direction.
Entry Signals:
Strong Buy: Triggered when:
Price is above the 564 EMA (uptrend).
The 5 EMA crosses above the 20 EMA (bullish crossover).
The current candle is green (close > open).
Strong Sell: Triggered when:
Price is below the 564 EMA (downtrend).
The 5 EMA crosses below the 20 EMA (bearish crossover).
The current candle is red (close < open).
Exit Signal:
Position is closed when the price touches back to the 564 EMA (either side, up or down):
A "Close Position" label is shown in green for long trades.
A "Close Position" label is shown in red for short trades.
Risk Management:
Stop-Loss: Placed at the last swing low (for longs) or last swing high (for shorts), calculated over the last 10 bars.
Take-Profit: A 1:3 risk/reward ratio is used, where the potential reward is three times the risk.
Alerts:
Alerts are triggered for buy and sell signals.
Alerts are also triggered when the exit condition (price touching the 564 EMA) is met.
This script is designed to work on timeframes of 15 minutes or higher but can also be used for 5-minute scalping. It plots the EMAs on the chart, highlights buy/sell opportunities, shows stop-loss and take-profit levels, and generates alerts for key signals.
오픈 소스 스크립트
트레이딩뷰의 진정한 정신에 따라, 이 스크립트의 작성자는 이를 오픈소스로 공개하여 트레이더들이 기능을 검토하고 검증할 수 있도록 했습니다. 작성자에게 찬사를 보냅니다! 이 코드는 무료로 사용할 수 있지만, 코드를 재게시하는 경우 하우스 룰이 적용된다는 점을 기억하세요.
면책사항
해당 정보와 게시물은 금융, 투자, 트레이딩 또는 기타 유형의 조언이나 권장 사항으로 간주되지 않으며, 트레이딩뷰에서 제공하거나 보증하는 것이 아닙니다. 자세한 내용은 이용 약관을 참조하세요.
오픈 소스 스크립트
트레이딩뷰의 진정한 정신에 따라, 이 스크립트의 작성자는 이를 오픈소스로 공개하여 트레이더들이 기능을 검토하고 검증할 수 있도록 했습니다. 작성자에게 찬사를 보냅니다! 이 코드는 무료로 사용할 수 있지만, 코드를 재게시하는 경우 하우스 룰이 적용된다는 점을 기억하세요.
면책사항
해당 정보와 게시물은 금융, 투자, 트레이딩 또는 기타 유형의 조언이나 권장 사항으로 간주되지 않으며, 트레이딩뷰에서 제공하거나 보증하는 것이 아닙니다. 자세한 내용은 이용 약관을 참조하세요.