OPEN-SOURCE SCRIPT
업데이트됨 63-Day Sector Relative Strength vs NIFTY
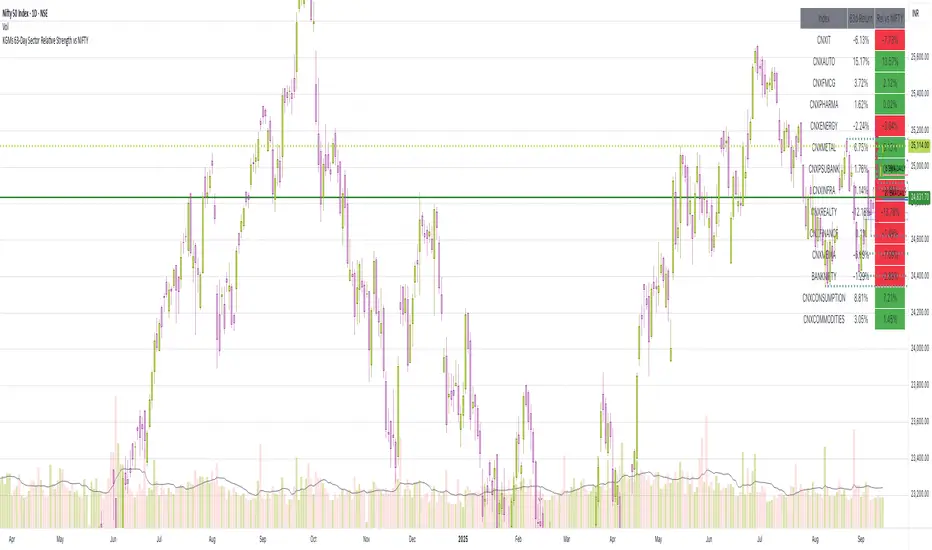
This script calculates and displays the 63-day returns of major NSE sectoral indices and their relative strength versus the NIFTY 50.
It,
Covered Indices: CNXIT, CNXAUTO, CNXFMCG, CNXPHARMA, CNXENERGY, CNXMETAL, CNXPSUBANK, CNXINFRA, CNXREALTY, CNXFINANCE, CNXMEDIA, BANKNIFTY, CNXCONSUMPTION, CNXCOMMODITIES
How to use this: Quickly identify which sectors are outperforming or underperforming relative to the NIFTY over the past 63 trading sessions (approx. 3 months).
It,
- [computes 63-day price returns for each sector index]
[calculates the relative performance of each sector against the Nifty 50]
[displays results in a table at the top right corner of the chart]
[highlights positive vs negative relative strength for quick comparision]
Covered Indices: CNXIT, CNXAUTO, CNXFMCG, CNXPHARMA, CNXENERGY, CNXMETAL, CNXPSUBANK, CNXINFRA, CNXREALTY, CNXFINANCE, CNXMEDIA, BANKNIFTY, CNXCONSUMPTION, CNXCOMMODITIES
How to use this: Quickly identify which sectors are outperforming or underperforming relative to the NIFTY over the past 63 trading sessions (approx. 3 months).
릴리즈 노트
This script calculates and displays the 63-day returns of major NSE sectoral indices and their relative strength versus the NIFTY 50.It,
- Computes 63-day price returns for each sector index.
- Calculates the relative performance of each sector against the NIFTY 50.
- Displays results in a neat table at the top-right corner of the chart.
- Highlights positive vs negative relative strength for quick comparison.
Covered Indices: CNXIT, CNXAUTO, CNXFMCG, CNXPHARMA, CNXENERGY, CNXMETAL, CNXPSUBANK, CNXINFRA, CNXREALTY, CNXFINANCE, CNXMEDIA, BANKNIFTY, CNXCONSUMPTION, CNXCOMMODITIES
Useful to quickly identify which sectors are outperforming or underperforming relative to the broader market (i.e. NIFTY) over the past 63 trading sessions (approx. 3 months). Useful for sector rotation analysis, relative momentum analysis and macro market views
오픈 소스 스크립트
트레이딩뷰의 진정한 정신에 따라, 이 스크립트의 작성자는 이를 오픈소스로 공개하여 트레이더들이 기능을 검토하고 검증할 수 있도록 했습니다. 작성자에게 찬사를 보냅니다! 이 코드는 무료로 사용할 수 있지만, 코드를 재게시하는 경우 하우스 룰이 적용된다는 점을 기억하세요.
면책사항
해당 정보와 게시물은 금융, 투자, 트레이딩 또는 기타 유형의 조언이나 권장 사항으로 간주되지 않으며, 트레이딩뷰에서 제공하거나 보증하는 것이 아닙니다. 자세한 내용은 이용 약관을 참조하세요.
오픈 소스 스크립트
트레이딩뷰의 진정한 정신에 따라, 이 스크립트의 작성자는 이를 오픈소스로 공개하여 트레이더들이 기능을 검토하고 검증할 수 있도록 했습니다. 작성자에게 찬사를 보냅니다! 이 코드는 무료로 사용할 수 있지만, 코드를 재게시하는 경우 하우스 룰이 적용된다는 점을 기억하세요.
면책사항
해당 정보와 게시물은 금융, 투자, 트레이딩 또는 기타 유형의 조언이나 권장 사항으로 간주되지 않으며, 트레이딩뷰에서 제공하거나 보증하는 것이 아닙니다. 자세한 내용은 이용 약관을 참조하세요.