PROTECTED SOURCE SCRIPT
Local Top & Bottom
This indicator looks at the rate of price change vs the rate of volume change. However, it does not look at all the volume. It looks at a predefined average volume. Then compares with red or green bar. It looks at the wick sizes compared with the body of the bar. It does this for previous certain number of bars. Also, It looks at how fast the wicks are increasing or decreasing at run time & in which directon for a bar.
Considering all these and a few more things, it then tries to assume whether next bar or next few bars may be down or up.
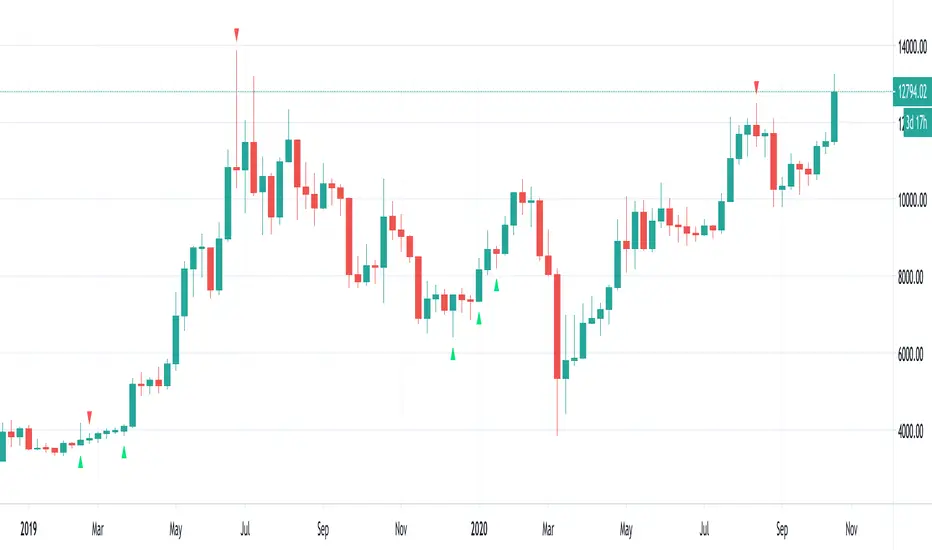
I call these local top and local bottom. It is better to wait for bar close.
The arrows point in which direction it is assuming the price will go.
I have not back tested it. Hence, I am not certain how great it will work in real life.
I will try to revise this as I go along.
Do note that the source code will not be revealed because I do not want to reveal the source code. However you are free to use it as it is without needing my permission.
Invalidation:
* If there is an arrow pointing up but the one of the next bar breaches the low of this bar, then this is invalidated
* if the arrow is point down but any of the next bar breaches the top of the bar, then this is invalidated
Considering all these and a few more things, it then tries to assume whether next bar or next few bars may be down or up.
I call these local top and local bottom. It is better to wait for bar close.
The arrows point in which direction it is assuming the price will go.
I have not back tested it. Hence, I am not certain how great it will work in real life.
I will try to revise this as I go along.
Do note that the source code will not be revealed because I do not want to reveal the source code. However you are free to use it as it is without needing my permission.
Invalidation:
* If there is an arrow pointing up but the one of the next bar breaches the low of this bar, then this is invalidated
* if the arrow is point down but any of the next bar breaches the top of the bar, then this is invalidated
보호된 스크립트입니다
이 스크립트는 비공개 소스로 게시됩니다. 하지만 이를 자유롭게 제한 없이 사용할 수 있습니다 – 자세한 내용은 여기에서 확인하세요.
For guides on how to use the Aladdin indicator or how to buy it, please check joy-bangla.gitbook.io/aladdin/
면책사항
해당 정보와 게시물은 금융, 투자, 트레이딩 또는 기타 유형의 조언이나 권장 사항으로 간주되지 않으며, 트레이딩뷰에서 제공하거나 보증하는 것이 아닙니다. 자세한 내용은 이용 약관을 참조하세요.