OPEN-SOURCE SCRIPT
업데이트됨 29&71 Goldbach levels
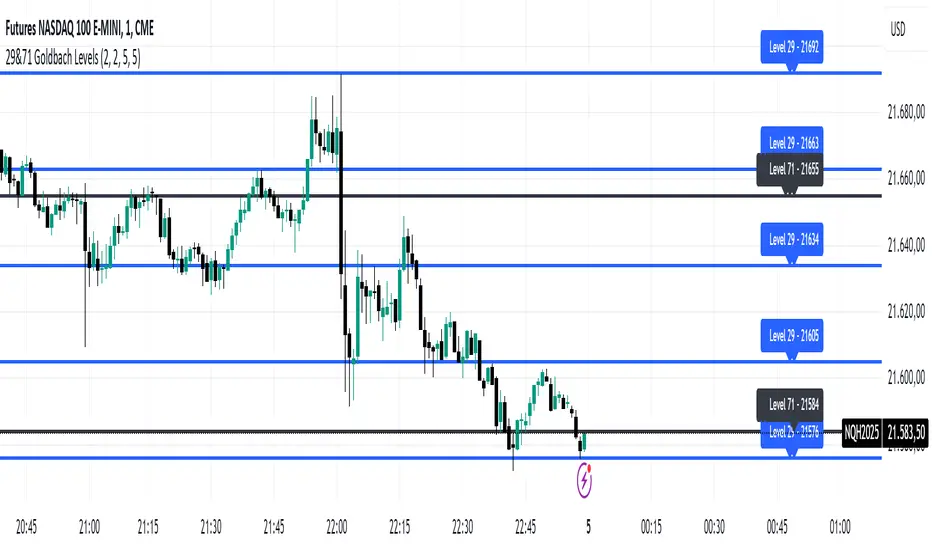
The indicator automatically plots horizontal lines at the 29 and 71 price levels on your chart. These levels serve as psychological barriers in the market, where price action may react or consolidate, just as prime numbers are fundamental in the theory of numbers.
---
Features:
- 29 Level: Identifies significant areas where market participants may encounter support or resistance, similar to the importance of prime numbers in Goldbach's conjecture.
- 71 Level: Marks another key zone that might indicate possible price breakouts or reversals, offering traders a reference point for decision-making.
- Customizable: You can adjust the colors, line styles, or alerts associated with these levels to fit your trading preferences.
How to Use:
- Use the 29 and 71 levels to spot potential areas of support or resistance on the chart.
- Watch for price reactions at these levels for possible breakout or reversal setups.
- Combine the levels with other technical indicators for added confirmation.
---
This indicator blends the theory of prime numbers with market analysis, offering traders a novel approach to identifying key levels that might influence price movements.
---
Features:
- 29 Level: Identifies significant areas where market participants may encounter support or resistance, similar to the importance of prime numbers in Goldbach's conjecture.
- 71 Level: Marks another key zone that might indicate possible price breakouts or reversals, offering traders a reference point for decision-making.
- Customizable: You can adjust the colors, line styles, or alerts associated with these levels to fit your trading preferences.
How to Use:
- Use the 29 and 71 levels to spot potential areas of support or resistance on the chart.
- Watch for price reactions at these levels for possible breakout or reversal setups.
- Combine the levels with other technical indicators for added confirmation.
---
This indicator blends the theory of prime numbers with market analysis, offering traders a novel approach to identifying key levels that might influence price movements.
릴리즈 노트
The indicator automatically plots horizontal lines at the 29 and 71 price levels on your chart. These levels serve as psychological barriers in the market, where price action may react or consolidate, just as prime numbers are fundamental in the theory of numbers.---
Features:
- 29 Level: Identifies significant areas where market participants may encounter support or resistance, similar to the importance of prime numbers in Goldbach's conjecture.
- 71 Level: Marks another key zone that might indicate possible price breakouts or reversals, offering traders a reference point for decision-making.
- Customizable: You can adjust the colors, line styles, or alerts associated with these levels to fit your trading preferences.
How to Use:
- Use the 29 and 71 levels to spot potential areas of support or resistance on the chart.
- Watch for price reactions at these levels for possible breakout or reversal setups.
- Combine the levels with other technical indicators for added confirmation.
---
This indicator blends the theory of prime numbers with market analysis, offering traders a novel approach to identifying key levels that might influence price movements.
릴리즈 노트
New version plotting by default 71 lev midpoints릴리즈 노트
New version with Midpoints for 29 and 71 levels릴리즈 노트
New version - small bugs solved오픈 소스 스크립트
트레이딩뷰의 진정한 정신에 따라, 이 스크립트의 작성자는 이를 오픈소스로 공개하여 트레이더들이 기능을 검토하고 검증할 수 있도록 했습니다. 작성자에게 찬사를 보냅니다! 이 코드는 무료로 사용할 수 있지만, 코드를 재게시하는 경우 하우스 룰이 적용된다는 점을 기억하세요.
면책사항
해당 정보와 게시물은 금융, 투자, 트레이딩 또는 기타 유형의 조언이나 권장 사항으로 간주되지 않으며, 트레이딩뷰에서 제공하거나 보증하는 것이 아닙니다. 자세한 내용은 이용 약관을 참조하세요.
오픈 소스 스크립트
트레이딩뷰의 진정한 정신에 따라, 이 스크립트의 작성자는 이를 오픈소스로 공개하여 트레이더들이 기능을 검토하고 검증할 수 있도록 했습니다. 작성자에게 찬사를 보냅니다! 이 코드는 무료로 사용할 수 있지만, 코드를 재게시하는 경우 하우스 룰이 적용된다는 점을 기억하세요.
면책사항
해당 정보와 게시물은 금융, 투자, 트레이딩 또는 기타 유형의 조언이나 권장 사항으로 간주되지 않으며, 트레이딩뷰에서 제공하거나 보증하는 것이 아닙니다. 자세한 내용은 이용 약관을 참조하세요.