OPEN-SOURCE SCRIPT
업데이트됨 Bollinger Band with RSI

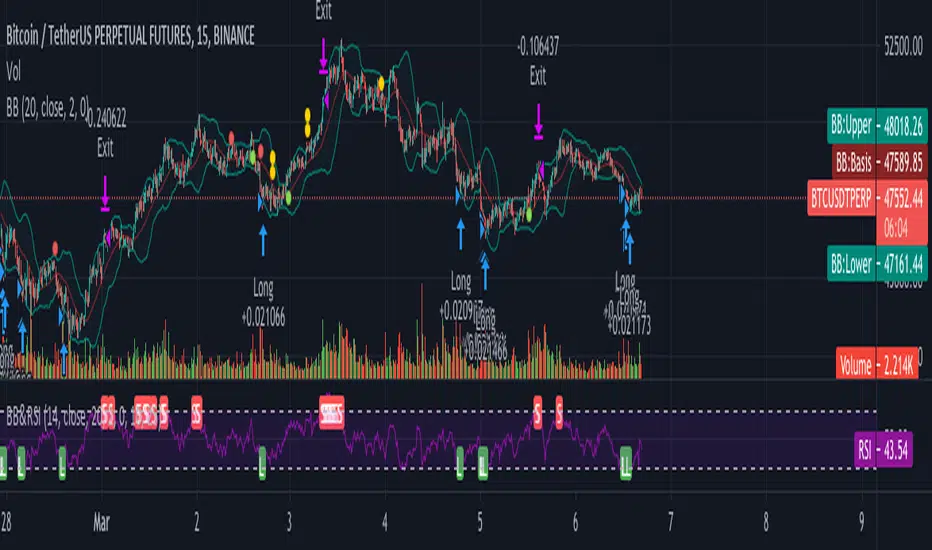
Using combination bollinger band and RSI indicator as guide to predict price volatility and the best entry point. The strategy logic is pretty straightforward where we're interested with close price that touches the lower bollinger band ; there are only two scenarios that will happened after the price reaches the lower band; the price might rebound from the lower bollinger band or drop lower and continue downtrend. To confirm the price movement, we use a second indicator which is the RSI to further investigate the price trend. For example, if the price reaches the lower bollinger band but the RSI value is not in the oversold region, we can conclude that the price will go lower and continue downtrend. If the RSI value is in the oversold region, we can use this price area as our entry point.
Stop loss is necessary to avoid losing too much capital if the RSI value lingers too long in the oversold region.
Best take profit area is when the price rebound above the middle bollinger band area/upper bollinger band or when the RSI reaches overbought region; whichever comes first.
Long entry:
RSI < 30 & close price < lower bollinger band
Exit entry:
RSI > 70
Default stop loss: -25%
릴리즈 노트
After more than two weeks of dry-run trading, bollinger band and rsi strategy are not able to accumulate huge profit. Some profits were lost due to lag on the indicators; rsi and bollinger band are pretty slow indicator for high frequency trading. Below is the summary of my trades using this strategy:Mode: Dry-run
Exchange: binance
Stake per trade: 40 USDT
Max open Trades: 0
Minimum ROI: {'0': 0.1}
Ask strategy: {"price_side": "ask", "use_order_book": false, "order_book_min": 1, "order_book_max": 1, "use_sell_signal": true, "sell_profit_only": false, "ignore_roi_if_buy_signal": false, "sell_profit_offset": 0.0, "ignore_buying_expired_candle_after": 0}
Bid strategy: {"price_side": "bid", "ask_last_balance": 0.0, "use_order_book": false, "order_book_top": 1, "check_depth_of_market": {"enabled": false, "bids_to_ask_delta": 1}}
Stoploss: -0.25
Timeframe: 15m
Strategy: bbandrsi
Current state: running
ROI: Closed trades
∙ -16.46963487 USDT (-0.57%) (-41.13 Σ%)
∙ -16.634 USD
ROI: All trades
∙ -19.92004824 USDT (-0.67%) (-49.75 Σ%)
∙ -20.119 USD
Total Trade Count: 74
First Trade opened: 2 weeks ago
Latest Trade opened: 18 hours ago
Win / Loss: 38 / 34
Avg. Duration: 1 day, 9:55:57
Best Performing: EOS/USDT: 27.16%
Use the strategy at your own risk.
오픈 소스 스크립트
트레이딩뷰의 진정한 정신에 따라, 이 스크립트의 작성자는 이를 오픈소스로 공개하여 트레이더들이 기능을 검토하고 검증할 수 있도록 했습니다. 작성자에게 찬사를 보냅니다! 이 코드는 무료로 사용할 수 있지만, 코드를 재게시하는 경우 하우스 룰이 적용된다는 점을 기억하세요.
면책사항
해당 정보와 게시물은 금융, 투자, 트레이딩 또는 기타 유형의 조언이나 권장 사항으로 간주되지 않으며, 트레이딩뷰에서 제공하거나 보증하는 것이 아닙니다. 자세한 내용은 이용 약관을 참조하세요.
오픈 소스 스크립트
트레이딩뷰의 진정한 정신에 따라, 이 스크립트의 작성자는 이를 오픈소스로 공개하여 트레이더들이 기능을 검토하고 검증할 수 있도록 했습니다. 작성자에게 찬사를 보냅니다! 이 코드는 무료로 사용할 수 있지만, 코드를 재게시하는 경우 하우스 룰이 적용된다는 점을 기억하세요.
면책사항
해당 정보와 게시물은 금융, 투자, 트레이딩 또는 기타 유형의 조언이나 권장 사항으로 간주되지 않으며, 트레이딩뷰에서 제공하거나 보증하는 것이 아닙니다. 자세한 내용은 이용 약관을 참조하세요.