PROTECTED SOURCE SCRIPT
Simple RSI Spotter

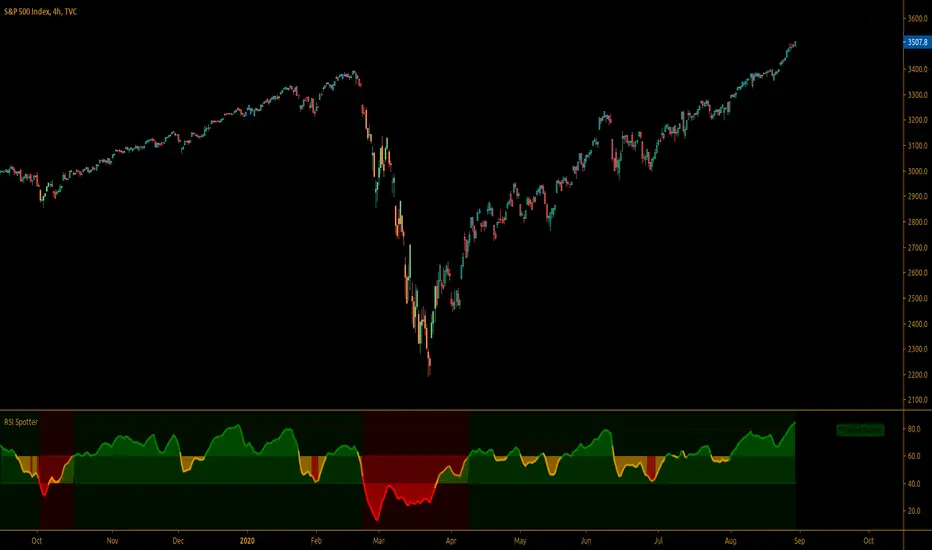
™TradeChartist Simple RSI Spotter is an elegant version of the classic RSI indicator and helps spot price trends using visually engaging and appealing RSI plot and background. The Bull and the Bear background fills are highly useful for traders who like to visually understand areas of entry and exit based on RSI .
===================================================================================================================
What does Simple RSI Spotter do?
===================================================================================================================
Note:
Default Settings:
5 period EMA Smoothed Heikin Ashi RSI.
For normal RSI, uncheck, Heikin Ashi RSI and change EMA RSI Smoothing to 1.
===================================================================================================================
This is a free to use indicator.
===================================================================================================================
===================================================================================================================
What does Simple RSI Spotter do?
- Plots RSI with visually engaging colours for Bull and Bear zones (Green and Red) with optional background fill.
- Plots RSI coloured bars on main chart based on user preferred Upper and Lower RSI band.
- Plots RSI based on Zero-Lag EMA smoothing (1 for Regular RSI without smoothing).
- Plots Heikin Ashi RSI if enabled from indicator settings.
- Plots RSI highs of Bull Zone and RSI lows of Bear Zone. Helps visually spot divergences.
===================================================================================================================
Note:
Default Settings:
5 period EMA Smoothed Heikin Ashi RSI.
For normal RSI, uncheck, Heikin Ashi RSI and change EMA RSI Smoothing to 1.
===================================================================================================================
This is a free to use indicator.
===================================================================================================================
보호된 스크립트입니다
이 스크립트는 비공개 소스로 게시됩니다. 하지만 이를 자유롭게 제한 없이 사용할 수 있습니다 – 자세한 내용은 여기에서 확인하세요.
Get in touch with me if you would like access to my Premium scripts for a trial before deciding on lifetime access.
Telegram - @Trade_Chartist
Free Scripts - bit.ly/Free-Scripts
Telegram - @Trade_Chartist
Free Scripts - bit.ly/Free-Scripts
면책사항
해당 정보와 게시물은 금융, 투자, 트레이딩 또는 기타 유형의 조언이나 권장 사항으로 간주되지 않으며, 트레이딩뷰에서 제공하거나 보증하는 것이 아닙니다. 자세한 내용은 이용 약관을 참조하세요.