PROTECTED SOURCE SCRIPT
Monthly Trend Heatmap – Price Change by Month
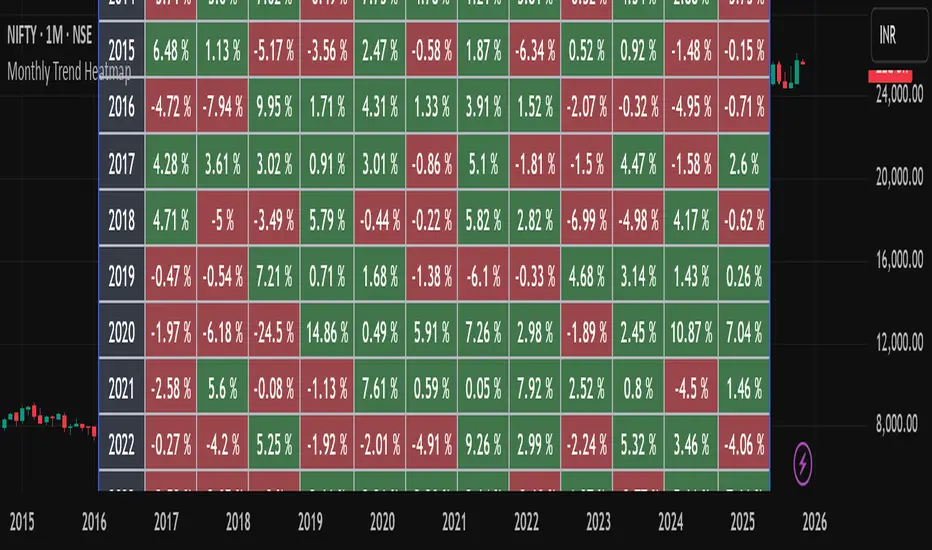
This indicator analyzes multi-year monthly price seasonality and displays it as a clear table of percentage returns for each month, from 2013 to the current year. By calculating the monthly open-to-close percentage change, it helps traders quickly identify recurring seasonal trends, positive or negative months, and long-term behavioral patterns of the selected market.
The goal of this tool is to make seasonal analysis accessible to everyday traders by presenting the data visually in a simple, structured, and easy-to-interpret format.
How It Works
This tool is not a signal generator and does not tell you when to buy or sell. It is a statistical seasonality visualizer meant to enhance decision-making.
The information provided is for educational and informational purposes only and should not be interpreted as financial, investment, or trading advice. Trading and investing in the stock market involve a high level of risk, including the potential loss of capital. Past performance does not guarantee future results, and no strategy or analysis can assure profits or prevent losses.
All examples, charts, scripts, indicators, or market discussions are strictly for demonstration, learning, and analytical purposes. No warranties or guarantees are made regarding accuracy, completeness, or future performance.
The goal of this tool is to make seasonal analysis accessible to everyday traders by presenting the data visually in a simple, structured, and easy-to-interpret format.
How It Works
- The script must be used on a 1-Month chart.
- For each month and each year, the indicator calculates:
- Monthly return = (Monthly Close – Monthly Open) / Monthly Open × 100
- The result is plotted inside a table, with green for positive months and red for negative months.
- Data auto-updates as new monthly candles form.
This tool is not a signal generator and does not tell you when to buy or sell. It is a statistical seasonality visualizer meant to enhance decision-making.
The information provided is for educational and informational purposes only and should not be interpreted as financial, investment, or trading advice. Trading and investing in the stock market involve a high level of risk, including the potential loss of capital. Past performance does not guarantee future results, and no strategy or analysis can assure profits or prevent losses.
All examples, charts, scripts, indicators, or market discussions are strictly for demonstration, learning, and analytical purposes. No warranties or guarantees are made regarding accuracy, completeness, or future performance.
보호된 스크립트입니다
이 스크립트는 비공개 소스로 게시됩니다. 하지만 이를 자유롭게 제한 없이 사용할 수 있습니다 – 자세한 내용은 여기에서 확인하세요.
면책사항
해당 정보와 게시물은 금융, 투자, 트레이딩 또는 기타 유형의 조언이나 권장 사항으로 간주되지 않으며, 트레이딩뷰에서 제공하거나 보증하는 것이 아닙니다. 자세한 내용은 이용 약관을 참조하세요.
보호된 스크립트입니다
이 스크립트는 비공개 소스로 게시됩니다. 하지만 이를 자유롭게 제한 없이 사용할 수 있습니다 – 자세한 내용은 여기에서 확인하세요.
면책사항
해당 정보와 게시물은 금융, 투자, 트레이딩 또는 기타 유형의 조언이나 권장 사항으로 간주되지 않으며, 트레이딩뷰에서 제공하거나 보증하는 것이 아닙니다. 자세한 내용은 이용 약관을 참조하세요.