OPEN-SOURCE SCRIPT
ACD - Layers 1 & 2
업데이트됨
An implementation of layers 1 & 2 of ACD strategy of Mark Fisher, based on the book "The Logical Trader".
This implementation contains:
- OR lines
- A lines
- C lines
- Daily pivot range
- N days pivot range
- Customizable trading session
Strategy summary (This implementation):
There is 3 main concepts, each of which represented as two price levels.
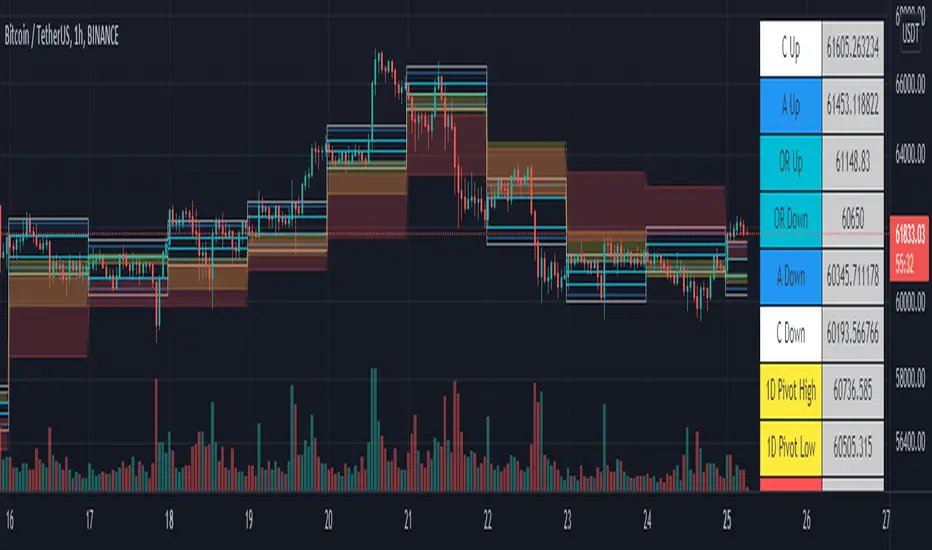
1) OR (Opening Range) is the range of the first bar of the day. In other words, it's just "high - low" of the first resolution (usually 15min.) bar of the day. So, OR lines (Aqua color) visualize this range for each trading session.
As stated by Mark Fisher in his book, this range is meant to be a statistically significant range such that when price breaks the range in one direction, This is UNUSUAL to infiltrate it again AND break through the other side. So we can consider it as a potential enter signal (long or short).
2) A lines (Blue color) are drawn above and below OR lines with difference of 10% 0f 10 days ATR. The ATR period and the A multiplier (usually 10%) is customizable.
3) C lines (Gray color) are drawn above and below OR lines at 15% of 10 Days ATR difference. These lines help detecting AND confirming that UNUSUAL situation.
These concepts form the layer 1, which you can spot potential opportunities with it.
There is also two ranges to show support and resistance levels based on price action of previous days. Pivot ranges are rolling ranges that calculated and last for each day separately. They only differ in calculation period - the first one is daily (yellow color area) and the other one (red color area) is customizable, but is usually 3 or 5 days.
Each range consists of two price levels, valid for the current trading session. One of theme is HL2 , and the other one is "HLC3 + abs(HLC3 - HL2 )".
These two ranges, "Daily pivot range" and "N days pivot range", form the layer 2, which you can see them as two dynamic support/resistance ranges - one for daily, and the other for N days. They help filtering opportunities spotted from layer 1.
There is 2 more layers in the ACD strategy, which is omitted in this free implementation.
This implementation contains:
- OR lines
- A lines
- C lines
- Daily pivot range
- N days pivot range
- Customizable trading session
Strategy summary (This implementation):
There is 3 main concepts, each of which represented as two price levels.
1) OR (Opening Range) is the range of the first bar of the day. In other words, it's just "high - low" of the first resolution (usually 15min.) bar of the day. So, OR lines (Aqua color) visualize this range for each trading session.
As stated by Mark Fisher in his book, this range is meant to be a statistically significant range such that when price breaks the range in one direction, This is UNUSUAL to infiltrate it again AND break through the other side. So we can consider it as a potential enter signal (long or short).
2) A lines (Blue color) are drawn above and below OR lines with difference of 10% 0f 10 days ATR. The ATR period and the A multiplier (usually 10%) is customizable.
3) C lines (Gray color) are drawn above and below OR lines at 15% of 10 Days ATR difference. These lines help detecting AND confirming that UNUSUAL situation.
These concepts form the layer 1, which you can spot potential opportunities with it.
There is also two ranges to show support and resistance levels based on price action of previous days. Pivot ranges are rolling ranges that calculated and last for each day separately. They only differ in calculation period - the first one is daily (yellow color area) and the other one (red color area) is customizable, but is usually 3 or 5 days.
Each range consists of two price levels, valid for the current trading session. One of theme is HL2 , and the other one is "HLC3 + abs(HLC3 - HL2 )".
These two ranges, "Daily pivot range" and "N days pivot range", form the layer 2, which you can see them as two dynamic support/resistance ranges - one for daily, and the other for N days. They help filtering opportunities spotted from layer 1.
There is 2 more layers in the ACD strategy, which is omitted in this free implementation.
릴리즈 노트
- Fix for setting OR time range.- Fix for drawing A and C lines.
릴리즈 노트
Release notes:- Making OR independent of chart timeframe: Now you can set the beginning time of OR and minutes used to calculate OR high/low
- Adding a table to show indicator values and as a guide for line colors.
- Adding plot titles (line names) to the Style tab, in order to customize them easily.
- Fixed n-days pivot bug.
- Making the session 24x7 and removing its check box.
오픈 소스 스크립트
진정한 TradingView 정신에 따라, 이 스크립트의 저자는 트레이더들이 이해하고 검증할 수 있도록 오픈 소스로 공개했습니다. 저자에게 박수를 보냅니다! 이 코드는 무료로 사용할 수 있지만, 출판물에서 이 코드를 재사용하는 것은 하우스 룰에 의해 관리됩니다. 님은 즐겨찾기로 이 스크립트를 차트에서 쓸 수 있습니다.
Regards,
Amin Saqi
linkedin.com/in/aminsaqi
Amin Saqi
linkedin.com/in/aminsaqi
면책사항
이 정보와 게시물은 TradingView에서 제공하거나 보증하는 금융, 투자, 거래 또는 기타 유형의 조언이나 권고 사항을 의미하거나 구성하지 않습니다. 자세한 내용은 이용 약관을 참고하세요.