PROTECTED SOURCE SCRIPT
KIMATIX Market Structure
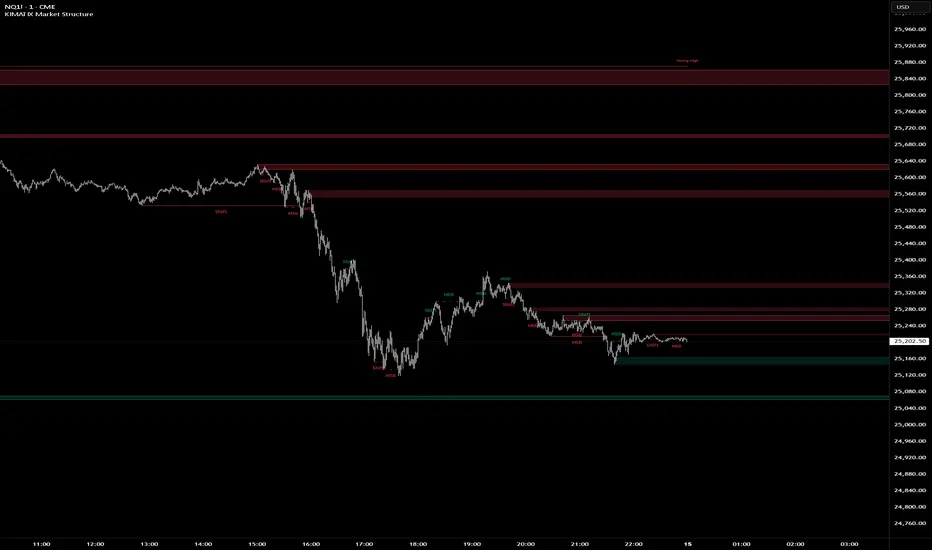
KIMATIX Market Structure is a professional-grade market structure and liquidity framework built for traders who focus on institutional price behavior, not lagging indicators.
This tool continuously analyzes price to map internal (micro) and external (macro) structure, giving you a clear read on whether the market is in continuation, transition, or reversal. Instead of guessing trend direction, you see it unfold in real time through structure breaks and shifts.
What the indicator helps you identify
Micro & Macro Market Structure
Internal structure for execution and timing
Higher-structure context for directional bias
Market Structure Breaks (MSB) vs. Shifts
MSB highlights continuation strength
Shift signals potential trend transition
Institutional Zones
Automatically derived zones where displacement occurred
Designed to highlight areas of likely reaction, mitigation, or continuation
Strong vs. Weak Highs and Lows
Instantly see which extremes are protected and which are vulnerable to liquidity raids
Optional Swing Logic (HH / HL / LH / LL)
For traders who want classic structure confirmation layered on top
Historical vs. Present Mode
Study full structure development or keep the chart clean and execution-focused
The indicator is intentionally not a signal generator. It is a decision-support tool designed to give clarity, context, and confluence. Best results come from combining it with session timing, liquidity concepts, and your execution model.
Built with strict object management and internal safeguards, the script remains fast and stable even on lower timeframes and extended chart history.
If you trade price action, liquidity, and structure, this tool is designed to fit seamlessly into your workflow.
More Indicators here: kimatixtrading.com
보호된 스크립트입니다
이 스크립트는 비공개 소스로 게시됩니다. 하지만 이를 자유롭게 제한 없이 사용할 수 있습니다 – 자세한 내용은 여기에서 확인하세요.
KIMATIX Trading
면책사항
해당 정보와 게시물은 금융, 투자, 트레이딩 또는 기타 유형의 조언이나 권장 사항으로 간주되지 않으며, 트레이딩뷰에서 제공하거나 보증하는 것이 아닙니다. 자세한 내용은 이용 약관을 참조하세요.
보호된 스크립트입니다
이 스크립트는 비공개 소스로 게시됩니다. 하지만 이를 자유롭게 제한 없이 사용할 수 있습니다 – 자세한 내용은 여기에서 확인하세요.
KIMATIX Trading
면책사항
해당 정보와 게시물은 금융, 투자, 트레이딩 또는 기타 유형의 조언이나 권장 사항으로 간주되지 않으며, 트레이딩뷰에서 제공하거나 보증하는 것이 아닙니다. 자세한 내용은 이용 약관을 참조하세요.