OPEN-SOURCE SCRIPT
Stock Performance Dashboard + Sector Performance
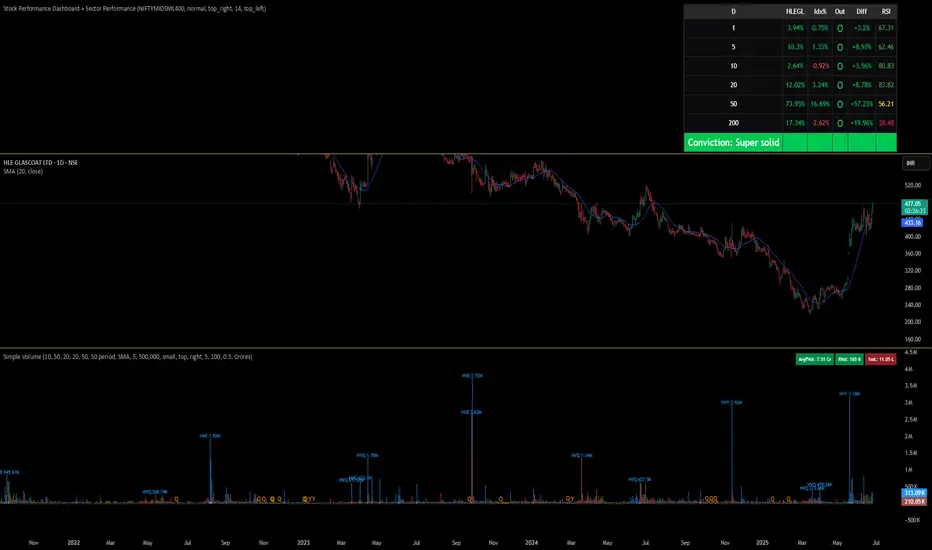
This indicator, Stock Performance Dashboard + Sector Performance, provides a comprehensive visual analysis of both individual stock performance and sectoral trends directly on your TradingView chart.
Key Features:
Performance Dashboard Table:
Displays the stock’s returns over multiple timeframes (1, 5, 10, 20, 50, 200 days) and compares them to a selected benchmark index (default: NIFTYMIDSML400).
Highlights whether the stock is outperforming the index for each period, shows the difference in performance, and includes an RSI (Relative Strength Index) column for additional momentum insight.
Calculates and displays a “conviction” score and level based on how often the stock outperforms the index across periods.
Sector Performance Table:
Ranks and displays the top-performing sectors from a predefined list of major NSE sector indices over four key periods (1D, 5D, 30D, 50D).
For each period, the top 5 sectors are shown, with color-coded performance for quick visual assessment.
Customization:
Includes options for dark/light mode, table size, position, and which columns to display.
Supports a compact “mini mode” for simplified visualization.
Usage:
This tool is ideal for traders and investors who want a quick, at-a-glance comparison of a stock’s short- and long-term momentum versus its benchmark, as well as a live snapshot of sector rotation and leadership in the Indian market. All data is presented in clear, color-coded tables for actionable decision-making.
오픈 소스 스크립트
트레이딩뷰의 진정한 정신에 따라, 이 스크립트의 작성자는 이를 오픈소스로 공개하여 트레이더들이 기능을 검토하고 검증할 수 있도록 했습니다. 작성자에게 찬사를 보냅니다! 이 코드는 무료로 사용할 수 있지만, 코드를 재게시하는 경우 하우스 룰이 적용된다는 점을 기억하세요.
면책사항
해당 정보와 게시물은 금융, 투자, 트레이딩 또는 기타 유형의 조언이나 권장 사항으로 간주되지 않으며, 트레이딩뷰에서 제공하거나 보증하는 것이 아닙니다. 자세한 내용은 이용 약관을 참조하세요.
오픈 소스 스크립트
트레이딩뷰의 진정한 정신에 따라, 이 스크립트의 작성자는 이를 오픈소스로 공개하여 트레이더들이 기능을 검토하고 검증할 수 있도록 했습니다. 작성자에게 찬사를 보냅니다! 이 코드는 무료로 사용할 수 있지만, 코드를 재게시하는 경우 하우스 룰이 적용된다는 점을 기억하세요.
면책사항
해당 정보와 게시물은 금융, 투자, 트레이딩 또는 기타 유형의 조언이나 권장 사항으로 간주되지 않으며, 트레이딩뷰에서 제공하거나 보증하는 것이 아닙니다. 자세한 내용은 이용 약관을 참조하세요.