OPEN-SOURCE SCRIPT
Geometric Mean Indicator
This script calculates and plots the Geometric Mean (GM) of two significant price levels (in this case, moving averages) to identify balance points or equilibrium levels in the market.
Key Components of the Script:
Input Variables:
length1: Defines the period for the first moving average (representing the first radius 𝑥x).
length2: Defines the period for the second moving average (representing the second radius
𝑦y).
Moving Averages (Price Levels):
ma1: The first moving average (calculated using the closing price over the period defined by length1).
ma2: The second moving average (calculated using the closing price over the period defined by length2).
Geometric Mean (GM) Calculation:
The geometric mean between the two moving averages is calculated as:
GM = sqrt(ma1 * ma2)
This value represents the midpoint or balance between the two price levels (analogous to the geometric mean between the radii in the mathematical discovery).
Plotting the Values:
The script plots:
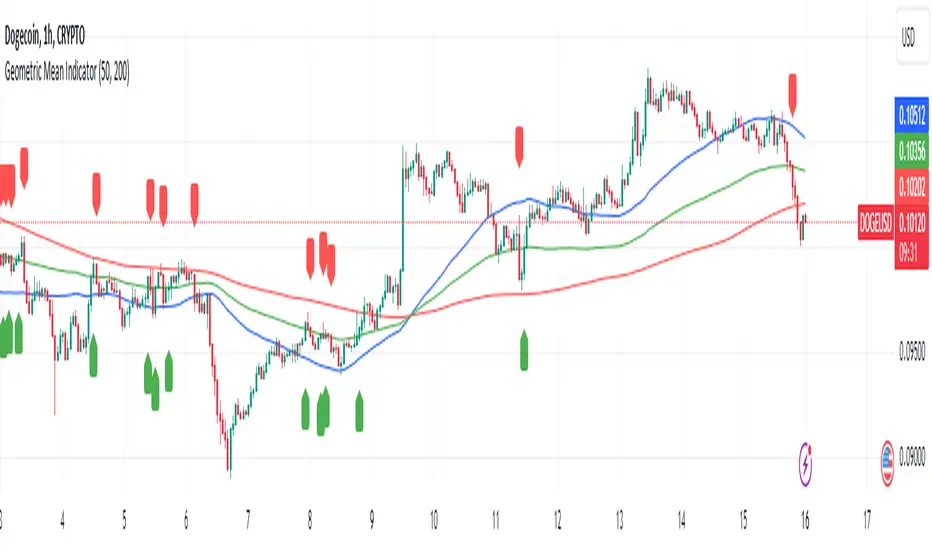
ma1: First moving average (blue line).
ma2: Second moving average (red line).
geometric_mean: The geometric mean of the two moving averages (green line), which serves as the dynamic equilibrium point.
Visual Markers for Crossovers:
The script detects when the price crosses above or below the geometric mean:
Green markers (below the bar) indicate a crossover above the geometric mean.
Red markers (above the bar) indicate a crossover below the geometric mean.
Purpose of the Indicator:
The Geometric Mean Indicator is designed to:
Highlight equilibrium points: The geometric mean between two price levels can signal areas where the market is balanced or poised for a potential breakout.
Detect potential trend reversals: When the price crosses above or below the geometric mean, it can indicate shifts in market momentum, similar to how the GM in geometry represents a transition point.
How to Use:
Dynamic Equilibrium: The geometric mean (green line) represents a balance between two price levels (moving averages) and can act as support or resistance.
Price Crossovers: Watch for price crossing the geometric mean to identify potential trend changes or areas of significant price action.
Adjust Inputs: You can modify the lengths of the moving averages (length1 and length2) to adjust the sensitivity of the indicator based on different timeframes or strategies.
Summary in Context of the Geometric Proof:
The script applies the geometric concept of the Geometric Mean (GM) as a balance point between two radii (represented by moving averages in this case).
It mirrors the idea that the GM is the midpoint of the tangent slope between two circles, where the moving averages (or price levels) serve as the "radii" in the market context.
Key Components of the Script:
Input Variables:
length1: Defines the period for the first moving average (representing the first radius 𝑥x).
length2: Defines the period for the second moving average (representing the second radius
𝑦y).
Moving Averages (Price Levels):
ma1: The first moving average (calculated using the closing price over the period defined by length1).
ma2: The second moving average (calculated using the closing price over the period defined by length2).
Geometric Mean (GM) Calculation:
The geometric mean between the two moving averages is calculated as:
GM = sqrt(ma1 * ma2)
This value represents the midpoint or balance between the two price levels (analogous to the geometric mean between the radii in the mathematical discovery).
Plotting the Values:
The script plots:
ma1: First moving average (blue line).
ma2: Second moving average (red line).
geometric_mean: The geometric mean of the two moving averages (green line), which serves as the dynamic equilibrium point.
Visual Markers for Crossovers:
The script detects when the price crosses above or below the geometric mean:
Green markers (below the bar) indicate a crossover above the geometric mean.
Red markers (above the bar) indicate a crossover below the geometric mean.
Purpose of the Indicator:
The Geometric Mean Indicator is designed to:
Highlight equilibrium points: The geometric mean between two price levels can signal areas where the market is balanced or poised for a potential breakout.
Detect potential trend reversals: When the price crosses above or below the geometric mean, it can indicate shifts in market momentum, similar to how the GM in geometry represents a transition point.
How to Use:
Dynamic Equilibrium: The geometric mean (green line) represents a balance between two price levels (moving averages) and can act as support or resistance.
Price Crossovers: Watch for price crossing the geometric mean to identify potential trend changes or areas of significant price action.
Adjust Inputs: You can modify the lengths of the moving averages (length1 and length2) to adjust the sensitivity of the indicator based on different timeframes or strategies.
Summary in Context of the Geometric Proof:
The script applies the geometric concept of the Geometric Mean (GM) as a balance point between two radii (represented by moving averages in this case).
It mirrors the idea that the GM is the midpoint of the tangent slope between two circles, where the moving averages (or price levels) serve as the "radii" in the market context.
오픈 소스 스크립트
트레이딩뷰의 진정한 정신에 따라, 이 스크립트의 작성자는 이를 오픈소스로 공개하여 트레이더들이 기능을 검토하고 검증할 수 있도록 했습니다. 작성자에게 찬사를 보냅니다! 이 코드는 무료로 사용할 수 있지만, 코드를 재게시하는 경우 하우스 룰이 적용된다는 점을 기억하세요.
면책사항
해당 정보와 게시물은 금융, 투자, 트레이딩 또는 기타 유형의 조언이나 권장 사항으로 간주되지 않으며, 트레이딩뷰에서 제공하거나 보증하는 것이 아닙니다. 자세한 내용은 이용 약관을 참조하세요.
오픈 소스 스크립트
트레이딩뷰의 진정한 정신에 따라, 이 스크립트의 작성자는 이를 오픈소스로 공개하여 트레이더들이 기능을 검토하고 검증할 수 있도록 했습니다. 작성자에게 찬사를 보냅니다! 이 코드는 무료로 사용할 수 있지만, 코드를 재게시하는 경우 하우스 룰이 적용된다는 점을 기억하세요.
면책사항
해당 정보와 게시물은 금융, 투자, 트레이딩 또는 기타 유형의 조언이나 권장 사항으로 간주되지 않으며, 트레이딩뷰에서 제공하거나 보증하는 것이 아닙니다. 자세한 내용은 이용 약관을 참조하세요.