INVITE-ONLY SCRIPT
업데이트됨 Market Profile-By Atropine

What is Market profile ?
- Market profile is a style of plotting "Price" on the Y-axis and "Time" on the X-axis, which most of the time form a bell-shaped image as the body of the profile.
It helps day traders identify Other Timeframe Participants (Big players) who have money and information power. short-term traders have to follow these big sharks which give direction to markets. - It provides an X-ray vision about the market as Value Area represents 70% of the day’s activity and this will give a clear picture of the current state of the market as it unfolds.
- It works in all market conditions. Usually, a trading system or indicator works in certain market conditions like a trending or sideways market. There is no such restriction to Market Profile as it clearly shows the balanced and imbalanced market conditions in both directions all the time.
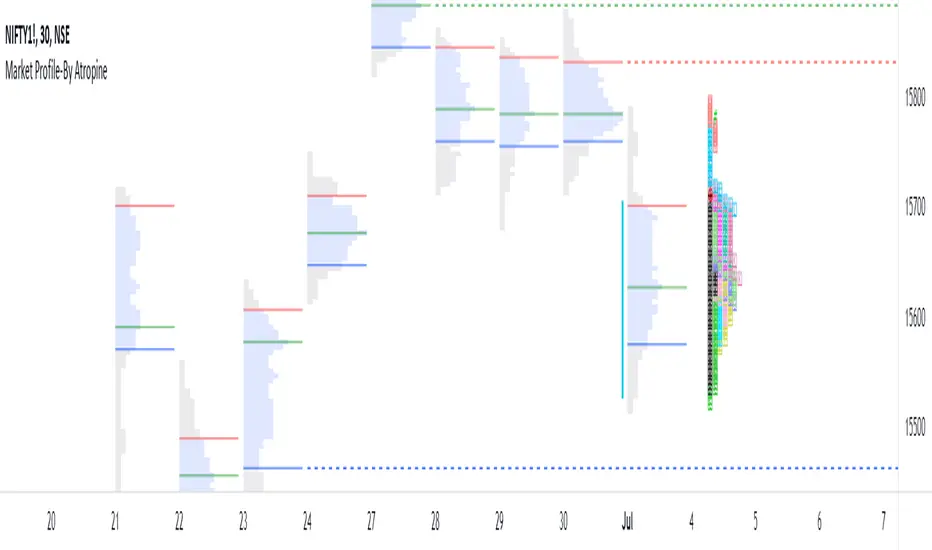
How does this Market Profile Indicator Works ?- Automatically plots TPO's for Each half an hour(30min) of the trading day, it is designated by a letter, which is also called Time Price Opportunity(TPO) for the current day. Indicator provides Option to Change TPO Text.
- First 30 min range denoted with the letter ‘A,’ next 30 min range with the letter ‘B’ ,this two TPO are black colored which Indicates IB (Initial Balance) Range. IB Range is the first one-hour range in the market created by retail traders (most of the time).
- Indicator plots TPO continue until the last range of the market, hence the last range is denoted with ‘M’ as the Indian markets currently trade from 9.15 am to 3.30 pm with the last session ‘M” is for only 15 minutes from 3.15 pm to 3.30 pm.
- Letter ‘O’ indicates the open price level, which is red colored and Letter ‘#’ indicates the closing price level which is green in colored.
- This Indicator gives you an Option to choose the color of each TPO's.
- Two Methods of Market Profile one is ‘Split’ profile, and another is ‘Un-Split’ profile, Indicator gives Option to Split or Unsplit the last day profile.
- This Indicator gives you an Options to extend Untested Lines(POC,VAH,VAL)The Price level in which maximum time was spent or maximum trading activity happened is called as Point of Control (POC).Value Area (VA) is the 70% price range around POC. It is the fair price of the Instrument on the particular day.
- Retail traders can only provide market depth and liquidity, but they fail to give magnitude and direction to the price.
- By the end of every trading day, the market profile chart shows not only what happened on that day, but also who is responsible and when it happened.
- Automatically plots TPO's for Each half an hour(30min) of the trading day, it is designated by a letter, which is also called Time Price Opportunity(TPO) for the current day. Indicator provides Option to Change TPO Text.
릴리즈 노트
Minimal Optimization.릴리즈 노트
- Fixed Close TPO Error while Splitting profile
- Minimal Optimization.
릴리즈 노트
- Fixed the Timeframe Error
릴리즈 노트
- Improved Script Loading Speed
릴리즈 노트
IB Line Error Removed초대 전용 스크립트
이 스크립트는 작성자가 승인한 사용자만 접근할 수 있습니다. 사용하려면 요청 후 승인을 받아야 하며, 일반적으로 결제 후에 허가가 부여됩니다. 자세한 내용은 아래 작성자의 안내를 따르거나 Bharatgawande12에게 직접 문의하세요.
트레이딩뷰는 스크립트의 작동 방식을 충분히 이해하고 작성자를 완전히 신뢰하지 않는 이상, 해당 스크립트에 비용을 지불하거나 사용하는 것을 권장하지 않습니다. 커뮤니티 스크립트에서 무료 오픈소스 대안을 찾아보실 수도 있습니다.
작성자 지시 사항
This is Invite only Indicator, You have to get Subscription to access it,from https://atropine.in
면책사항
해당 정보와 게시물은 금융, 투자, 트레이딩 또는 기타 유형의 조언이나 권장 사항으로 간주되지 않으며, 트레이딩뷰에서 제공하거나 보증하는 것이 아닙니다. 자세한 내용은 이용 약관을 참조하세요.
초대 전용 스크립트
이 스크립트는 작성자가 승인한 사용자만 접근할 수 있습니다. 사용하려면 요청 후 승인을 받아야 하며, 일반적으로 결제 후에 허가가 부여됩니다. 자세한 내용은 아래 작성자의 안내를 따르거나 Bharatgawande12에게 직접 문의하세요.
트레이딩뷰는 스크립트의 작동 방식을 충분히 이해하고 작성자를 완전히 신뢰하지 않는 이상, 해당 스크립트에 비용을 지불하거나 사용하는 것을 권장하지 않습니다. 커뮤니티 스크립트에서 무료 오픈소스 대안을 찾아보실 수도 있습니다.
작성자 지시 사항
This is Invite only Indicator, You have to get Subscription to access it,from https://atropine.in
면책사항
해당 정보와 게시물은 금융, 투자, 트레이딩 또는 기타 유형의 조언이나 권장 사항으로 간주되지 않으며, 트레이딩뷰에서 제공하거나 보증하는 것이 아닙니다. 자세한 내용은 이용 약관을 참조하세요.