OPEN-SOURCE SCRIPT
업데이트됨 Multi-timeframe Trend & Momentum Dashboard
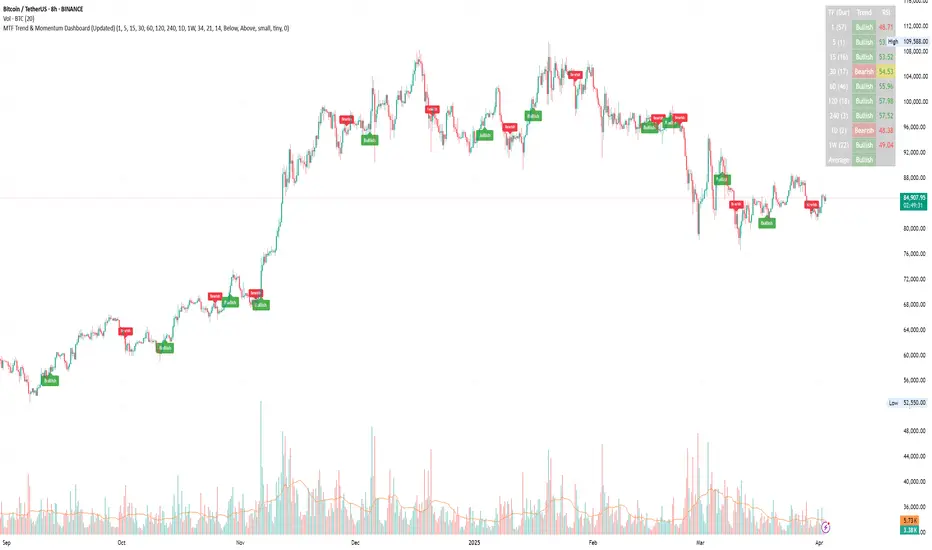
Multi-Timeframe Trend & Momentum Dashboard
This indicator is a comprehensive multi-timeframe analysis tool designed for traders who want to quickly assess market trends and momentum across several timeframes. It combines trend detection with duration tracking and displays key information in an easy-to-read on-chart table. Key features include:
Multi-Timeframe Analysis:
Analyzes nine different timeframes (from 1-minute up to 1-week) simultaneously, helping you gauge the overall market trend at a glance.
Trend Detection & Duration:
Uses a combination of a short-term EMA and a long-term SMA to determine whether the market is bullish, bearish, or neutral. It also tracks how long the current trend has persisted in terms of consecutive bars and displays this duration next to each timeframe.
RSI Display & Visual Alerts:
Calculates the RSI for each timeframe. RSI values are color-coded—green when above 50 (indicating bullish momentum) and red when below 50 (indicating bearish conditions). Additionally, if the market is bearish on a particular timeframe while the RSI is above 50, the RSI cell flashes yellow to alert you of a potential trend reversal or divergence.
On-Chart Trend Start Markers:
When a new trend is detected on your current chart’s timeframe, the indicator automatically marks the bar with a label showing the new trend direction, providing a clear visual cue for trend changes.
This powerful tool is perfect for traders looking to combine multi-timeframe trend analysis with momentum indicators, enabling a more informed and dynamic trading strategy. Whether you’re a day trader or swing trader, the Multi-Timeframe Trend & Momentum Dashboard brings clarity to market conditions across multiple time horizons.
릴리즈 노트
Update DescriptionLabel Placement Options:
Added new inputs allowing the user to choose whether bullish labels appear above or below the bar (default set to “Above”) and bearish labels below or above the bar (default set to “Below”). This gives you control over where the trend start labels are placed on the chart.
Label Customization:
New inputs have been introduced for label customization. You can now select:
The background color for bullish and bearish labels.
The text color for each label.
The label size, with options such as “tiny,” “small,” “normal,” and “large.”
릴리즈 노트
Short Update DescriptionNew Table Options: Added an option to show or hide the trend/RSI table.
MA Diff Column: Included a new table column displaying the difference between the EMA and SMA.
Label Transparency: Introduced an input to adjust label transparency.
릴리즈 노트
.오픈 소스 스크립트
트레이딩뷰의 진정한 정신에 따라, 이 스크립트의 작성자는 이를 오픈소스로 공개하여 트레이더들이 기능을 검토하고 검증할 수 있도록 했습니다. 작성자에게 찬사를 보냅니다! 이 코드는 무료로 사용할 수 있지만, 코드를 재게시하는 경우 하우스 룰이 적용된다는 점을 기억하세요.
면책사항
해당 정보와 게시물은 금융, 투자, 트레이딩 또는 기타 유형의 조언이나 권장 사항으로 간주되지 않으며, 트레이딩뷰에서 제공하거나 보증하는 것이 아닙니다. 자세한 내용은 이용 약관을 참조하세요.
오픈 소스 스크립트
트레이딩뷰의 진정한 정신에 따라, 이 스크립트의 작성자는 이를 오픈소스로 공개하여 트레이더들이 기능을 검토하고 검증할 수 있도록 했습니다. 작성자에게 찬사를 보냅니다! 이 코드는 무료로 사용할 수 있지만, 코드를 재게시하는 경우 하우스 룰이 적용된다는 점을 기억하세요.
면책사항
해당 정보와 게시물은 금융, 투자, 트레이딩 또는 기타 유형의 조언이나 권장 사항으로 간주되지 않으며, 트레이딩뷰에서 제공하거나 보증하는 것이 아닙니다. 자세한 내용은 이용 약관을 참조하세요.