PROTECTED SOURCE SCRIPT
Relative Strength Momentum
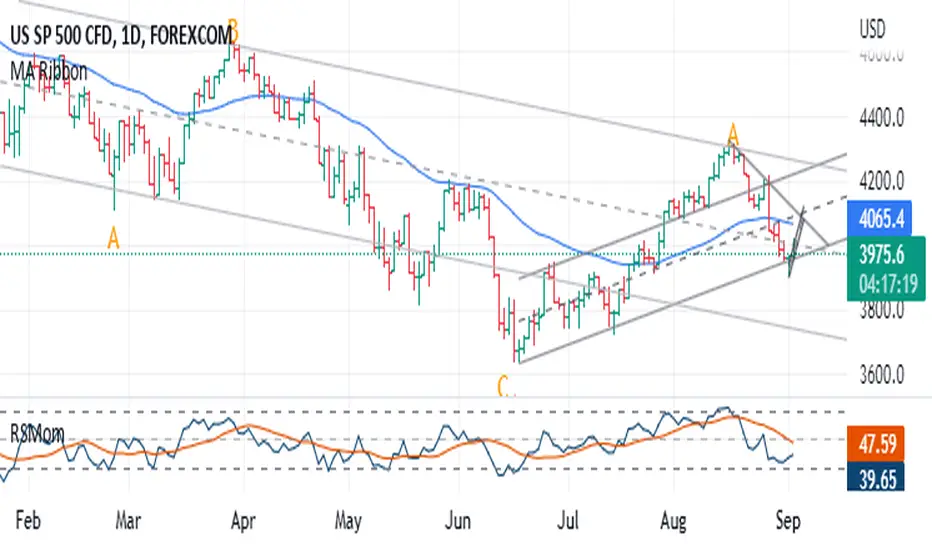
The RSI is a traders friend - it can provide insight that other indicators simply cannot. The RSI achilles heel is that it can often fail to highlight divergence. Constance Brown attempted to resolve this problem with the 'Composite index' - a powerful tool. However.. for me, looking at two indicators can get a bit much - especially if viewing multiple time-frames. I want one tool which provides the RSI, it's ranging/reversal behaviour (as documented by Andrew Cardwell) and a better grasp of momentum swings (via divergence and reversal signals). So this is my best effort, and I hope it can prove useful to some of you. At first the differences may be hard to spot - but they are there!
- My default settings are optimised - as with the 'normal' RSI you can expect a bullish trend to result in few (if any) moves below 30. In a bearish trend, you can expect few (if any) incursions above 70. Cardwell's observations apply. I recommend using this with a 50 period EMA to provide some additional context.
보호된 스크립트입니다
이 스크립트는 비공개 소스로 게시됩니다. 하지만 이를 자유롭게 제한 없이 사용할 수 있습니다 – 자세한 내용은 여기에서 확인하세요.
면책사항
해당 정보와 게시물은 금융, 투자, 트레이딩 또는 기타 유형의 조언이나 권장 사항으로 간주되지 않으며, 트레이딩뷰에서 제공하거나 보증하는 것이 아닙니다. 자세한 내용은 이용 약관을 참조하세요.
보호된 스크립트입니다
이 스크립트는 비공개 소스로 게시됩니다. 하지만 이를 자유롭게 제한 없이 사용할 수 있습니다 – 자세한 내용은 여기에서 확인하세요.
면책사항
해당 정보와 게시물은 금융, 투자, 트레이딩 또는 기타 유형의 조언이나 권장 사항으로 간주되지 않으며, 트레이딩뷰에서 제공하거나 보증하는 것이 아닙니다. 자세한 내용은 이용 약관을 참조하세요.