OPEN-SOURCE SCRIPT
업데이트됨 Gunzo Market SR
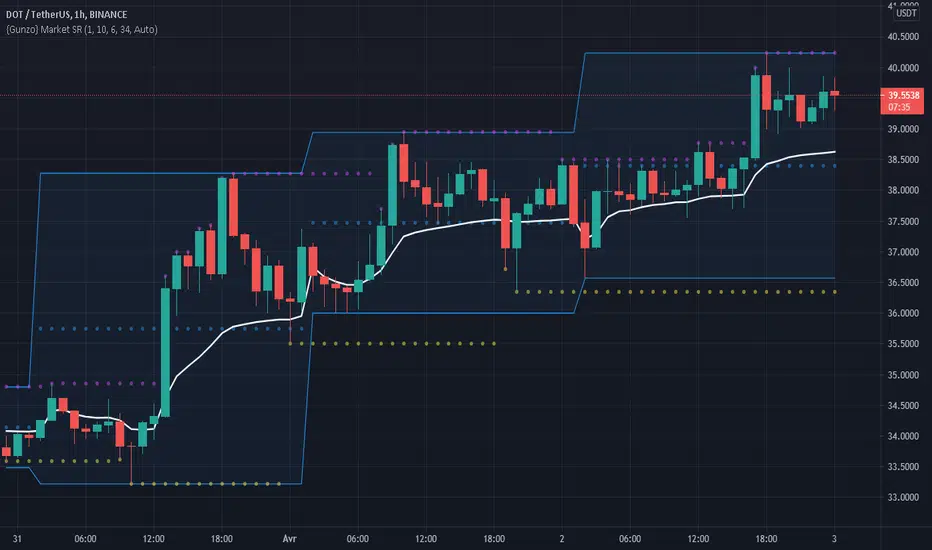
Gunzo Market SR is a set of 3 tools combined for trend analysis on day trading strategy.
VWAP (Volume Weighted Average Price) :
The VWAP indicator is generally used for trend analysis. For example if the VWAP line is under the closing price for a long period of time, the trend is strong. In this script, the VWAP has been optimized for day trading as the indicator is calculated inside the daily range, and resets when a new day starts. This way the indicator reflects the daily trend and not the overall trend. You can also use the position of closing price according to the VWAP to find optimal entry points according to the indicator.
Highs / Lows :
The Highs / Lows are generally used for trend analysis too. The High / Lows are mainly used to identify prices that have been key during the past and that we can use as an indication for the following candles. In this script, the Highs / Lows are computed on the daily period and then displayed on the current period (recommended to use on a daily period or lower). This way the indicator reflects the highest point and the lowest point of the day (can be modified to have a longer range of pivot days even if I recommend to stay on 1 day for day trading).
Support / Resistance :
The Support / Resistance is generally used for trend analysis too. The Support / Resistance are found by searching local high and lows. The longer the supports and resistance are, the strongest it can be considered. In this script, the Highs / Lows are computed by default on a lower time frame (usually 3-4 times lower). For example on a 15 minute graph, the Highs / Lows will be computed on the 5 minute graph (can be modified if the displayed result is not optimized for your asset).
How to use this set of tools :
I personally recommend to use this tool at the start of your day of trading. This way you will get a clear vision of the daily situation and try to identify key prices and the trend for the current day. I then suggest to set up an alert on the key price to be notified when you're getting close to it.
릴리즈 노트
updated screenshot릴리즈 노트
Fixed a bug on the vwap calculation on time frames greater or equal to 1 hour.Fixed a bug in the cumulative sum of vwap.
Added conditions for setting up alerts on key moment of the script (crossed above, crossed under).
Added a legend in the script for better understanding the script.
Reorganized the "thanks area" and added more thanks.
Added min values for inputs.
Fixed minor code alignement.
릴리즈 노트
screenshot modification오픈 소스 스크립트
트레이딩뷰의 진정한 정신에 따라, 이 스크립트의 작성자는 이를 오픈소스로 공개하여 트레이더들이 기능을 검토하고 검증할 수 있도록 했습니다. 작성자에게 찬사를 보냅니다! 이 코드는 무료로 사용할 수 있지만, 코드를 재게시하는 경우 하우스 룰이 적용된다는 점을 기억하세요.
면책사항
해당 정보와 게시물은 금융, 투자, 트레이딩 또는 기타 유형의 조언이나 권장 사항으로 간주되지 않으며, 트레이딩뷰에서 제공하거나 보증하는 것이 아닙니다. 자세한 내용은 이용 약관을 참조하세요.
오픈 소스 스크립트
트레이딩뷰의 진정한 정신에 따라, 이 스크립트의 작성자는 이를 오픈소스로 공개하여 트레이더들이 기능을 검토하고 검증할 수 있도록 했습니다. 작성자에게 찬사를 보냅니다! 이 코드는 무료로 사용할 수 있지만, 코드를 재게시하는 경우 하우스 룰이 적용된다는 점을 기억하세요.
면책사항
해당 정보와 게시물은 금융, 투자, 트레이딩 또는 기타 유형의 조언이나 권장 사항으로 간주되지 않으며, 트레이딩뷰에서 제공하거나 보증하는 것이 아닙니다. 자세한 내용은 이용 약관을 참조하세요.