OPEN-SOURCE SCRIPT
Previous Highs & Lows [LuxAlgo]
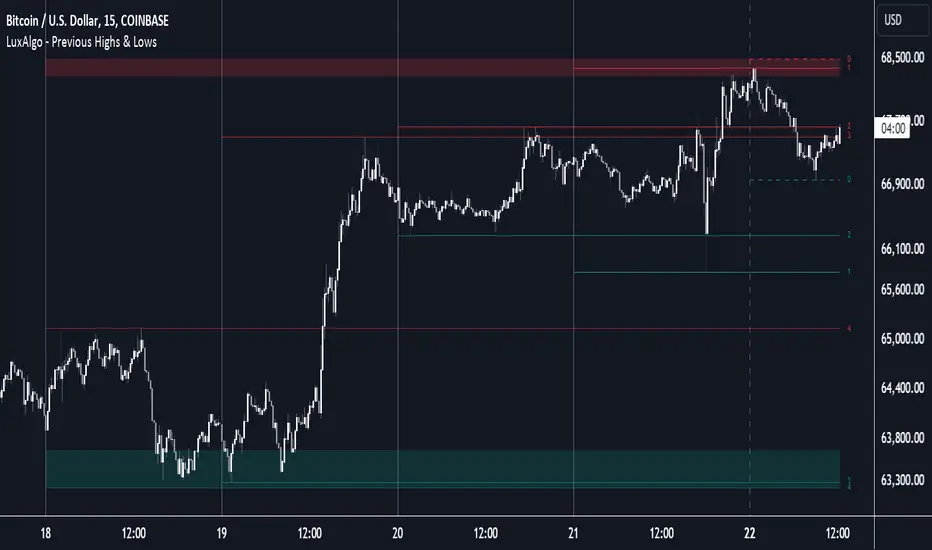
The Previous Highs & Lows indicator highlights a user-set amount of previous maximum/minimum prices made within specific intervals, these are displayed as levels customizable levels.
Additionally, one upper and lower zone constructed from the previously displayed highs/lows is included, providing support/resistance areas.
🔶 USAGE

Previous highs/lows are often perceived as key trading levels with the potential of generating multiple reactions upon being reached.

While the daily interval is more commonly used, users can use different intervals, with the indicator supporting hourly, daily, weekly, monthly, and yearly intervals. Using higher intervals on low timeframes can return more distant levels relative to the most recent price, which might not be relevant.
Each level is numbered, with more recent previous highs/lows having a lower number associated with them, users can also highlight more recent levels through a transparency gradient.

Users can control the amount of previous highs/lows displayed using the "Show Last" settings, with a higher value providing more potential support/resistance. Returned previous highs/lows can eventually be filtered out based on their position by enabling the "Filter Based On Position" setting, only keeping previous highs above the current closing price and previous lows below the current closing price, giving more relevant levels as a result.
🔹Previous High/Low Areas

The indicator includes two areas constructed from the respective percentiles of the returned previous highs/lows. These can be useful as more general support/resistance areas.
Wider areas are often indicative of a group of previous highs or lows being more dispersed, resulting in areas that are easier to reach. Wider areas can also be obtained by increasing the "Areas Width" setting.
Note: Areas will only be displayed if "Show Last" is greater than 1
🔶 SETTINGS
🔹Style
Additionally, one upper and lower zone constructed from the previously displayed highs/lows is included, providing support/resistance areas.
🔶 USAGE
Previous highs/lows are often perceived as key trading levels with the potential of generating multiple reactions upon being reached.
While the daily interval is more commonly used, users can use different intervals, with the indicator supporting hourly, daily, weekly, monthly, and yearly intervals. Using higher intervals on low timeframes can return more distant levels relative to the most recent price, which might not be relevant.
Each level is numbered, with more recent previous highs/lows having a lower number associated with them, users can also highlight more recent levels through a transparency gradient.
Users can control the amount of previous highs/lows displayed using the "Show Last" settings, with a higher value providing more potential support/resistance. Returned previous highs/lows can eventually be filtered out based on their position by enabling the "Filter Based On Position" setting, only keeping previous highs above the current closing price and previous lows below the current closing price, giving more relevant levels as a result.
🔹Previous High/Low Areas
The indicator includes two areas constructed from the respective percentiles of the returned previous highs/lows. These can be useful as more general support/resistance areas.
Wider areas are often indicative of a group of previous highs or lows being more dispersed, resulting in areas that are easier to reach. Wider areas can also be obtained by increasing the "Areas Width" setting.
Note: Areas will only be displayed if "Show Last" is greater than 1
🔶 SETTINGS
- Show Last: Determines the amount of more recent previous highs and previous low levels displayed by the indicator.
- Interval: Interval used to capture maximum/minimum price values,
- Areas Width: Width of the displayed top/bottom areas, with higher values returning wider areas.
- Filter Based On Position: When enabled only display previous highs above the current closing price and previous lows below the current closing price.
🔹Style
- Minimum Gradient Transparency: Minimum transparency value applied to the colors of the oldest displayed previous highs/lows levels.
오픈 소스 스크립트
트레이딩뷰의 진정한 정신에 따라, 이 스크립트의 작성자는 이를 오픈소스로 공개하여 트레이더들이 기능을 검토하고 검증할 수 있도록 했습니다. 작성자에게 찬사를 보냅니다! 이 코드는 무료로 사용할 수 있지만, 코드를 재게시하는 경우 하우스 룰이 적용된다는 점을 기억하세요.
Get exclusive indicators & AI trading strategies: luxalgo.com
Free 150k+ community: discord.gg/lux
All content provided by LuxAlgo is for informational & educational purposes only. Past performance does not guarantee future results.
Free 150k+ community: discord.gg/lux
All content provided by LuxAlgo is for informational & educational purposes only. Past performance does not guarantee future results.
면책사항
해당 정보와 게시물은 금융, 투자, 트레이딩 또는 기타 유형의 조언이나 권장 사항으로 간주되지 않으며, 트레이딩뷰에서 제공하거나 보증하는 것이 아닙니다. 자세한 내용은 이용 약관을 참조하세요.