PROTECTED SOURCE SCRIPT
Stochastic by Edwin K
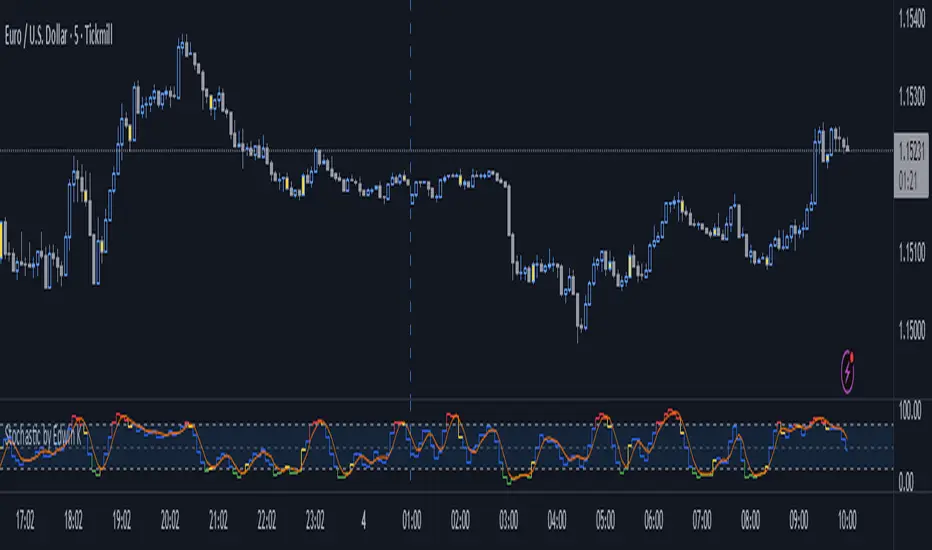
What it shows
This indicator measures momentum and overbought/oversold zones using the Stochastic Oscillator (%K and %D).
It helps you see when price momentum is **turning**, **overextended**, or **ready to reverse**.
How to read it
Blue line (%K): Fast momentum line — reacts quickly to price.
Orange line (%D):Slow signal line — confirms direction.
Zone shading:
Above 80 = Overbought zone (price stretched upward)
Below 20 = Oversold zone (price stretched downward)
Bar turns yellow: momentum warning — possible reversal or pullback coming.
Yellow signal meaning
The bar turns yellow when:
%K crosses below 80 (momentum leaving overbought zone → early sell signal) or
%K crosses above 20 (momentum leaving oversold zone → early buy signal).
This is your momentum shift alert — the market may start reversing or correcting soon.
How to trade it
1. Reversal entries
Buy when %K crosses up through 20 (oversold to bullish).
Sell when %K crosses down through 80 (overbought to bearish).
Yellow bars confirm the shift.
2. Trend filter
For better accuracy, confirm with trend direction (e.g., EMA or price structure):
Only take buy signals when price is above an EMA (e.g., 50 EMA).
Only take sell signals when price is below it.
보호된 스크립트입니다
이 스크립트는 비공개 소스로 게시됩니다. 하지만 이를 자유롭게 제한 없이 사용할 수 있습니다 – 자세한 내용은 여기에서 확인하세요.
면책사항
해당 정보와 게시물은 금융, 투자, 트레이딩 또는 기타 유형의 조언이나 권장 사항으로 간주되지 않으며, 트레이딩뷰에서 제공하거나 보증하는 것이 아닙니다. 자세한 내용은 이용 약관을 참조하세요.
면책사항
해당 정보와 게시물은 금융, 투자, 트레이딩 또는 기타 유형의 조언이나 권장 사항으로 간주되지 않으며, 트레이딩뷰에서 제공하거나 보증하는 것이 아닙니다. 자세한 내용은 이용 약관을 참조하세요.