OPEN-SOURCE SCRIPT
Clustered Asset Moving Average @shrilss
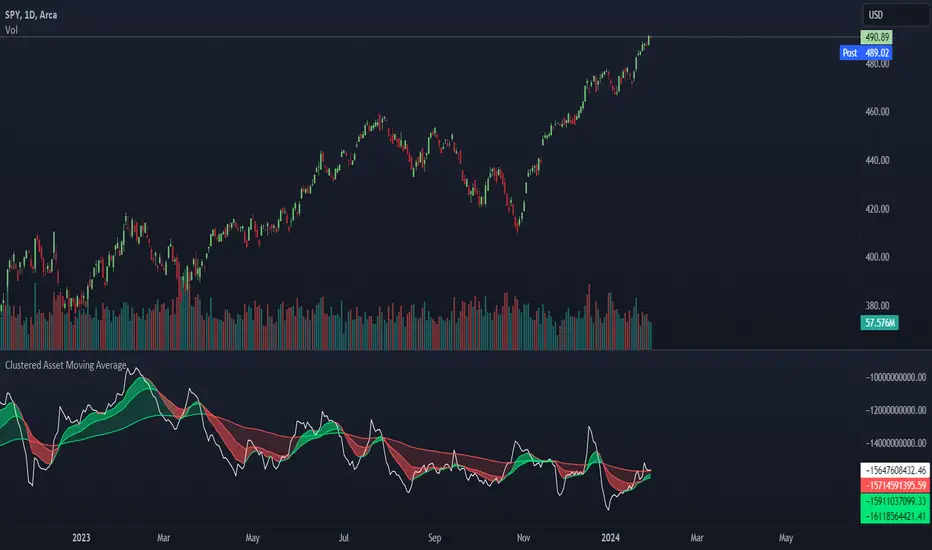
The Clustered Asset Moving Average script is designed to provide traders with a unique perspective on a cluster of multiple assets. By combining the closing prices and volumes of 12 specified assets, this indicator calculates a Clustered Moving Average to reveal potential trends and market sentiment within this asset cluster.
Key Features:
- Asset Cluster Analysis:
The script considers 12 assets, including well-known names such as Google (GOOG), Microsoft (MSFT), Apple (AAPL), Tesla (TSLA), and others.
It calculates the price and volume of each asset to form a comprehensive view of the asset cluster.
- Clustered Moving Average Calculation:
The Asset Price and Volume are combined to calculate the Clustered Moving Average
This moving average reflects the relationship between the aggregated price and volume of the specified assets.
- Multiple Exponential Moving Averages (EMA):
The script includes three EMAs (10, 25, and 100) applied to the Clustered Moving Average, providing different time perspectives.
Users can customize the visibility of each EMA based on their trading preferences.
- Visual Representation:
The indicator offers a visual representation of the Clustered Moving Average, allowing traders to quickly identify trends and potential reversal points.
Different EMAs are color-coded, enhancing visual clarity.
오픈 소스 스크립트
트레이딩뷰의 진정한 정신에 따라, 이 스크립트의 작성자는 이를 오픈소스로 공개하여 트레이더들이 기능을 검토하고 검증할 수 있도록 했습니다. 작성자에게 찬사를 보냅니다! 이 코드는 무료로 사용할 수 있지만, 코드를 재게시하는 경우 하우스 룰이 적용된다는 점을 기억하세요.
면책사항
해당 정보와 게시물은 금융, 투자, 트레이딩 또는 기타 유형의 조언이나 권장 사항으로 간주되지 않으며, 트레이딩뷰에서 제공하거나 보증하는 것이 아닙니다. 자세한 내용은 이용 약관을 참조하세요.
오픈 소스 스크립트
트레이딩뷰의 진정한 정신에 따라, 이 스크립트의 작성자는 이를 오픈소스로 공개하여 트레이더들이 기능을 검토하고 검증할 수 있도록 했습니다. 작성자에게 찬사를 보냅니다! 이 코드는 무료로 사용할 수 있지만, 코드를 재게시하는 경우 하우스 룰이 적용된다는 점을 기억하세요.
면책사항
해당 정보와 게시물은 금융, 투자, 트레이딩 또는 기타 유형의 조언이나 권장 사항으로 간주되지 않으며, 트레이딩뷰에서 제공하거나 보증하는 것이 아닙니다. 자세한 내용은 이용 약관을 참조하세요.