PROTECTED SOURCE SCRIPT
Ruthless Support and Resistance Conformation
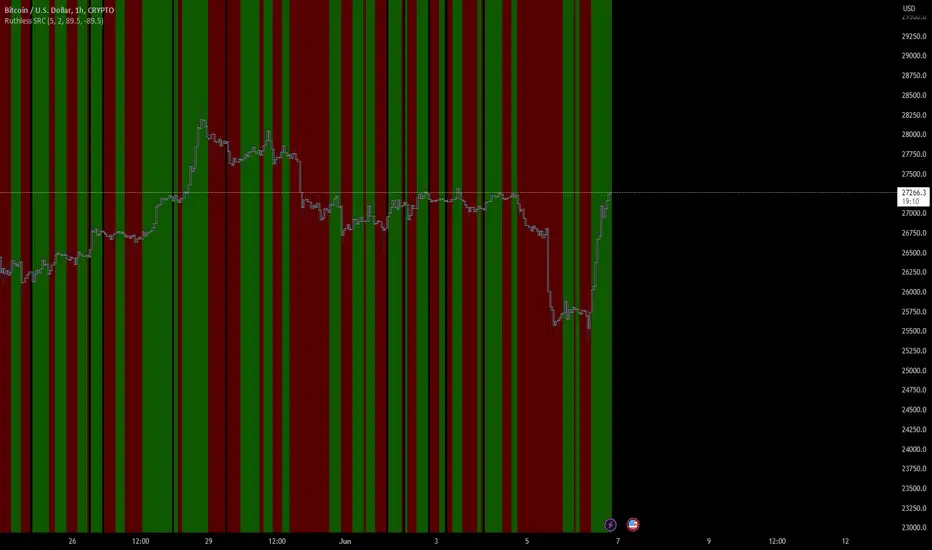
The Ruthless Support and Resistance Conformation (SRC) indicator is designed to identify and confirm support and resistance levels in the price chart. It utilizes an exponential moving average (EMA) and calculates the angle between the current EMA value and a previous EMA value over a specified length.
The indicator visually represents the conformation of support and resistance levels by plotting colored backgrounds on the chart. When the angle of the EMA surpasses the upper threshold, indicating a strong upward movement, the background color turns red. Conversely, when the angle drops below the lower threshold, indicating a significant downward movement, the background color turns green. In areas where the angle remains within the thresholds, the background color is set to a lighter shade.
Traders can utilize this indicator to identify potential areas of support and resistance based on the conformation of the EMA angle. The upper threshold can indicate potential resistance levels, while the lower threshold can indicate potential support levels.
To provide additional clarity, the indicator also includes horizontal lines representing the upper and lower thresholds on the chart, allowing traders to visually gauge the conformation against these levels.
Please note that this indicator should be used in conjunction with other technical analysis tools and indicators to make well-informed trading decisions. It is recommended to customize the length, thresholds, and other parameters of the indicator based on individual trading strategies and preferences.
보호된 스크립트입니다
이 스크립트는 비공개 소스로 게시됩니다. 하지만 이를 자유롭게 제한 없이 사용할 수 있습니다 – 자세한 내용은 여기에서 확인하세요.
면책사항
해당 정보와 게시물은 금융, 투자, 트레이딩 또는 기타 유형의 조언이나 권장 사항으로 간주되지 않으며, 트레이딩뷰에서 제공하거나 보증하는 것이 아닙니다. 자세한 내용은 이용 약관을 참조하세요.
보호된 스크립트입니다
이 스크립트는 비공개 소스로 게시됩니다. 하지만 이를 자유롭게 제한 없이 사용할 수 있습니다 – 자세한 내용은 여기에서 확인하세요.
면책사항
해당 정보와 게시물은 금융, 투자, 트레이딩 또는 기타 유형의 조언이나 권장 사항으로 간주되지 않으며, 트레이딩뷰에서 제공하거나 보증하는 것이 아닙니다. 자세한 내용은 이용 약관을 참조하세요.