OPEN-SOURCE SCRIPT
업데이트됨 Fed Rate Change Impact
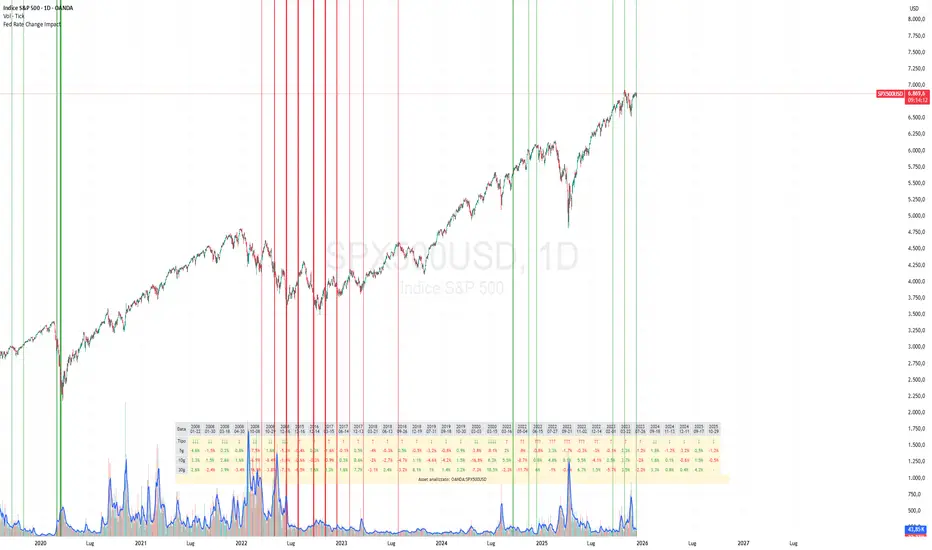
📊 Fed Rate Change Impact — Macro Event-Driven Indicator
Fed Rate Change Impact is an advanced indicator designed to analyze the impact of Federal Reserve interest rate changes on financial markets. It integrates event-driven logic with dynamic visualization, percentage diagnostics, and multi-asset selection, offering a clear and customizable view of post-event effects.
🔍 Key Features 📅 Preloaded Fed Events: Includes over 30 historical rate cut (↓) and hike (↑) dates from 2008 to 2024.
📈 Post-Event Analysis: Calculates the percentage change of the selected asset 5, 10, and 30 days after each event.
📌 Vertical Chart Lines: Visually highlights each event directly on the chart, with dynamic coloring (red for hikes, green for cuts).
📋 Diagnostic Table: Displays real-time impact for each event, with color-coded values and a compact layout.
🧠 Interactive Filter: Choose to display only hikes, only cuts, or both.
🧭 Flexible Asset Selection: Analyze the current chart asset, pick from a predefined list, or manually input any ticker via input.symbol().
🎯 Contextual Highlighting: The table highlights the analyzed asset if it matches the active chart symbol.
⚙️ Customizable Parameters lookahead5, lookahead10, lookahead30: Define the time horizon for measuring post-event impact.
eventFilter: Choose which type of events to display.
presetAsset / customAsset: Select or input the asset to analyze.
🧪 Recommended Use Cases Macroeconomic analysis on indices, commodities, crypto, and forex
Studying delayed effects of rate changes on sensitive assets
Building event-driven strategies or diagnostic overlays
Visual backtesting and cross-asset comparison
🧠 Technical Notes The indicator is compatible with overlay=true and works best on Daily timeframe.
The table automatically adapts to the number of events and includes visual padding for improved readability.
All calculations are performed in real time and require no external data.
릴리즈 노트
. new FED dates must be added in the presetAsset릴리즈 노트
* correct arrangement of vertical lines릴리즈 노트
Update cut - The size of the lines refers to the extent of the change in rates오픈 소스 스크립트
트레이딩뷰의 진정한 정신에 따라, 이 스크립트의 작성자는 이를 오픈소스로 공개하여 트레이더들이 기능을 검토하고 검증할 수 있도록 했습니다. 작성자에게 찬사를 보냅니다! 이 코드는 무료로 사용할 수 있지만, 코드를 재게시하는 경우 하우스 룰이 적용된다는 점을 기억하세요.
면책사항
해당 정보와 게시물은 금융, 투자, 트레이딩 또는 기타 유형의 조언이나 권장 사항으로 간주되지 않으며, 트레이딩뷰에서 제공하거나 보증하는 것이 아닙니다. 자세한 내용은 이용 약관을 참조하세요.
오픈 소스 스크립트
트레이딩뷰의 진정한 정신에 따라, 이 스크립트의 작성자는 이를 오픈소스로 공개하여 트레이더들이 기능을 검토하고 검증할 수 있도록 했습니다. 작성자에게 찬사를 보냅니다! 이 코드는 무료로 사용할 수 있지만, 코드를 재게시하는 경우 하우스 룰이 적용된다는 점을 기억하세요.
면책사항
해당 정보와 게시물은 금융, 투자, 트레이딩 또는 기타 유형의 조언이나 권장 사항으로 간주되지 않으며, 트레이딩뷰에서 제공하거나 보증하는 것이 아닙니다. 자세한 내용은 이용 약관을 참조하세요.