PROTECTED SOURCE SCRIPT
ADX + DI w/ Colored Candles [CW_Trades]
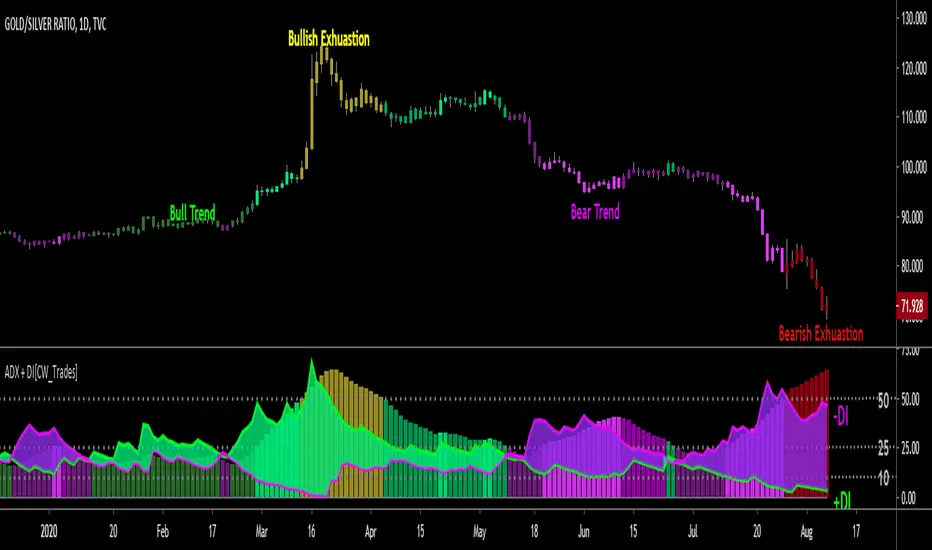
The Average Directional Index (ADX) is a technical analysis indicator used to determine price trend and price strength by comparing current price to recent price history. The price trend can be either up or down(bullish/bearish), and this is shown by two accompanying indicators, the Negative Directional Indicator (-DI, purple line) and the Positive Directional Indicator (+DI, green line) which compare price highs to price lows on a 14-period lookback. The strength of the trend is shown by the histogram in the background and also utilizes a 14-period lookback in its calculation.
When the +DI is trending above the -DI it indicates a short-term bullish trend in price. If the histogram is rising while the +DI is above the -DI it indicates strength in the bullish trend. If the histogram is declining while the +DI is above the -DI it indicates weakness in the bullish trend.
When the -DI is trending above the +DI it indicates a short-term bullish trend in price. If the histogram is rising while the -DI is above the +DI it indicates strength in the bearish trend. If the histogram is declining while the -DI is above the +DI it indicates weakness in the bearish trend.
When the +DI is above the -DI the histogram will be colored shades of green. When the -DI is above the +DI the histogram will be colored shades of purple.
The ADX has 3 key levels to watch, and they are 10, 25 and 50.
-When the ADX histogram bars are below 10 it indicates no identifiable strength in the price trend, or neutral. The histogram bars will be colored gray when the ADX is below 10.
-When the ADX histogram bars are between 10 and 25 it indicates a weak trend in price. The histogram bars will be shades of dark green or dark purple when in this zone.
-When the ADX histogram bars are above 25 and below 50 it indicates a strong trend in price. The histogram bars will be shades of medium green/purple or bright green/purple when the ADX is between 25
and 50. Bright green or bright purple indicate that the current histogram bar is higher than the preceding histogram bar, medium shades of either green or purple indicate that the current histogram bar is
lower than the preceding histogram bar. The brighter the shade of green or purple, the stronger the trend.
-When the ADX histogram bars are above 50 it indicates potential trend exhaustion. When the +DI is above the -DI and the ADX is above 50 the histogram will be colored yellow which indicates a potential
end of the bull trend. When the -DI is above the +DI and the histogram bars are above 50 the histogram will be colored red which indicates a potential end of the bearish trend.
보호된 스크립트입니다
이 스크립트는 비공개 소스로 게시됩니다. 하지만 이를 자유롭게 제한 없이 사용할 수 있습니다 – 자세한 내용은 여기에서 확인하세요.
면책사항
해당 정보와 게시물은 금융, 투자, 트레이딩 또는 기타 유형의 조언이나 권장 사항으로 간주되지 않으며, 트레이딩뷰에서 제공하거나 보증하는 것이 아닙니다. 자세한 내용은 이용 약관을 참조하세요.
보호된 스크립트입니다
이 스크립트는 비공개 소스로 게시됩니다. 하지만 이를 자유롭게 제한 없이 사용할 수 있습니다 – 자세한 내용은 여기에서 확인하세요.
면책사항
해당 정보와 게시물은 금융, 투자, 트레이딩 또는 기타 유형의 조언이나 권장 사항으로 간주되지 않으며, 트레이딩뷰에서 제공하거나 보증하는 것이 아닙니다. 자세한 내용은 이용 약관을 참조하세요.