OPEN-SOURCE SCRIPT
MTF ADX & DI - Monitoring Panel
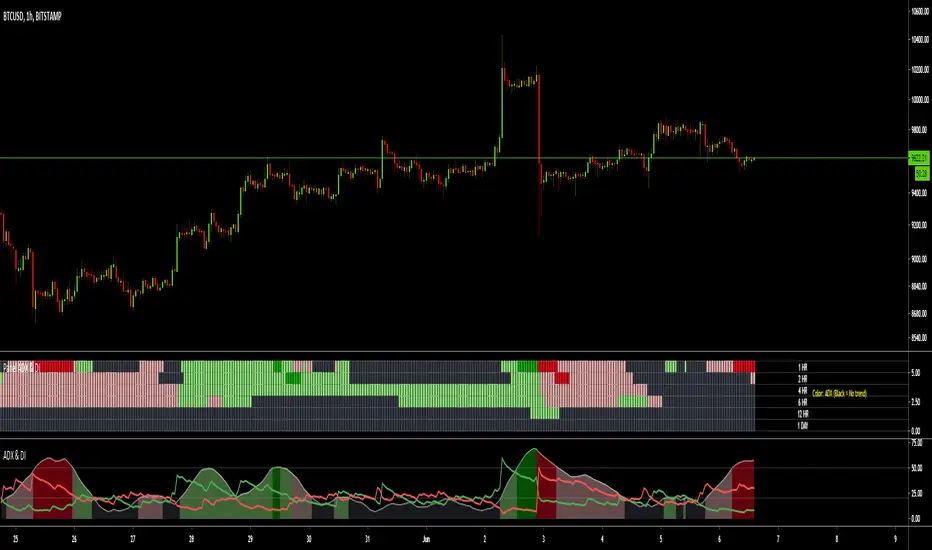
Monitoring panel showing the ADX (Average Directional Index) & DMI (Directional Movement Index) as color code for 6 different timeframes.
This gives a very easy overview on the current state of the market and if it is trending.
- ADX basically describes the strength of a Trend
- DMI give indication on the direction of the trend, usually shown as +DI and -DI
Meanings of the Colors:
ADX is below Low Threshold (no trend) : Black
ADX is above Low Threshold and DI is positive (weak bullish trend) : Light Green
ADX is above High Threshold and DI is positive (strong bullish trend) : Dark Green
ADX is above Low Threshold and DI is negative (weak bearish trend) : Light Red
ADX is above High Threshold and DI is negative (strong bearish trend) : Dark Red
- Low Threshold (default = 20) and High Threshold (default = 50) can be changed in the settings
- Timeframes can be changed, but the description labels are currently hardcoded - if you want to change it, just copy the script and change them
- Currently there are two additional timeframes commented in the code - if you want to use them, just copy the script and uncomment them
Have fun and as always I am open for constructive feedback.
Cheers!
오픈 소스 스크립트
트레이딩뷰의 진정한 정신에 따라, 이 스크립트의 작성자는 이를 오픈소스로 공개하여 트레이더들이 기능을 검토하고 검증할 수 있도록 했습니다. 작성자에게 찬사를 보냅니다! 이 코드는 무료로 사용할 수 있지만, 코드를 재게시하는 경우 하우스 룰이 적용된다는 점을 기억하세요.
The new Order Block Finder V2 is available as invite-only script. Please visit the website for all the details and how to get access:
sites.google.com/view/wugamlo-indicators/
sites.google.com/view/wugamlo-indicators/
면책사항
해당 정보와 게시물은 금융, 투자, 트레이딩 또는 기타 유형의 조언이나 권장 사항으로 간주되지 않으며, 트레이딩뷰에서 제공하거나 보증하는 것이 아닙니다. 자세한 내용은 이용 약관을 참조하세요.